
Figure 5.
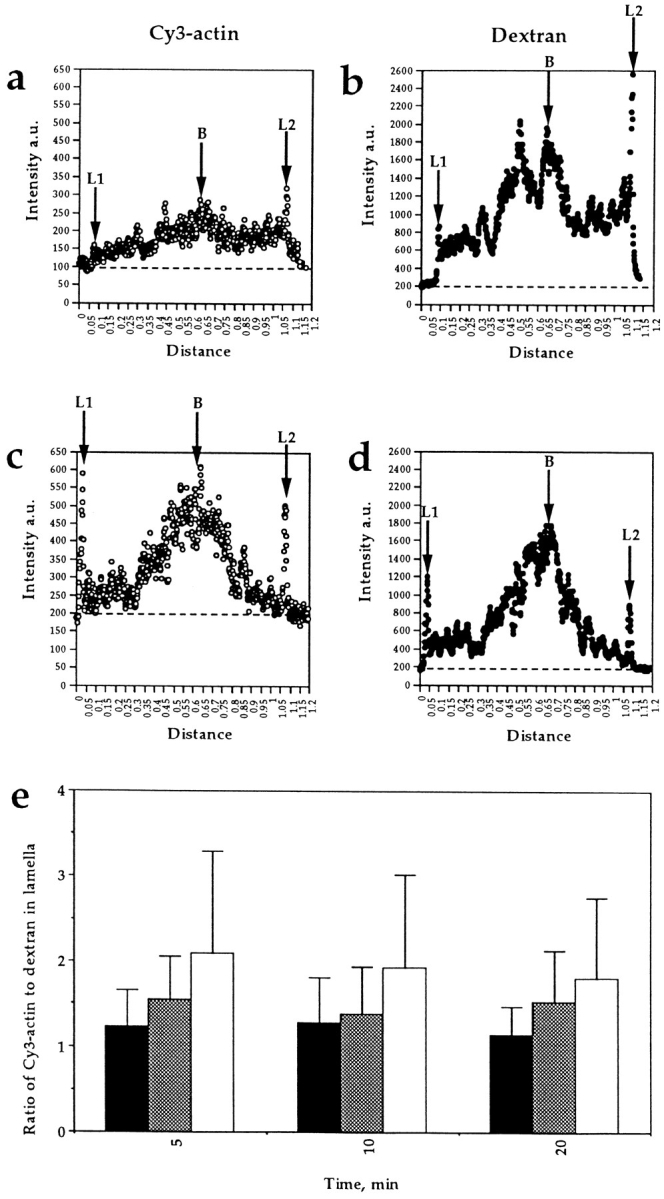
Quantitation of Cy3-actin in Rac or PDGF-induced lamellipodia. Serum-starved quiescent confluent Swiss 3T3 cells were treated under three different conditions: (a) injected with fluorescein dextran and Cy3-actin and incubated for 5, 10, or 20 min; (b) injected with fluorescein dextran and Cy3-actin and incubated for 5, 10, or 20 min in the presence of PDGF; and (c) injected with fluorescein dextran, constitutively active recombinant Rac protein, and Cy3-actin and incubated for 5, 10, or 20 min. The relative amount of Cy3-actin to fluorescein dextran concentrated in the lamellipodium of each cell was quantitated using a Hamamatsu C4880 cooled CCD camera. The fluorescence intensity profiles (for both the red and green fluorescence channels) of a line drawn across an entire starved cell 20 min after Cy3-actin and fluorescein dextran are shown in a and b. Intensity is in arbitrary units vs distance across the cell in arbitrary units, with ∼0.1 U = 5 μm. Similar profiles are shown in c and d for a starved cell 20 min after injection with constitutively active Rac, Cy3- actin, and fluorescein dextran. The peripheral lamellipodium was defined as the first (L1) or last (L2) peak of either dextran or actin fluorescence (see arrows in a–d). The wide peak in the middle of the cell is the cell body near the nucleus (B). Dashed lines in each graph indicate the background fluorescence of the substrate, which was subtracted from all peak heights. The bar graph in e shows a summary of the relative amount of Cy3-actin (to fluorescein dextran) concentrated in the lamellipodium averaged for at least 20 cells at each condition and time. (Black bars) Starved cells injected with Cy3-actin and fluorescein dextran. (Gray bars) Starved cells injected with Cy3-actin and fluorescein dextran and treated with PDGF. (White bars) Starved cells injected with Cy3-actin, fluorescein dextran, and constitutively active Rac protein. All values obtained for Rac-induced accumulation of Cy3-actin were significantly different from the mean values for the starved cells to >99.5% confidence using the t test assuming unequal variance among the samples. For the PDGF-treated cells, the data at 5 min were significantly different from the starved cells with 97% confidence, the data at 10 min were significantly different with 77% confidence, and the data at 20 min were significantly different with 99% confidence.