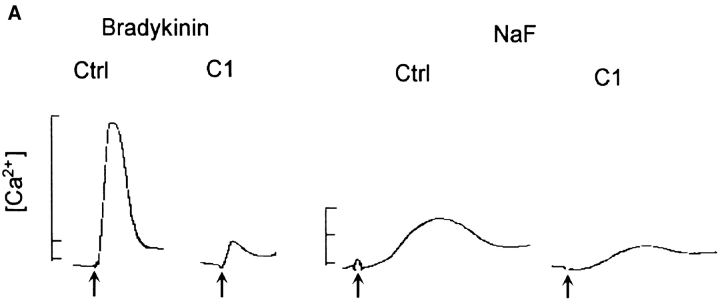
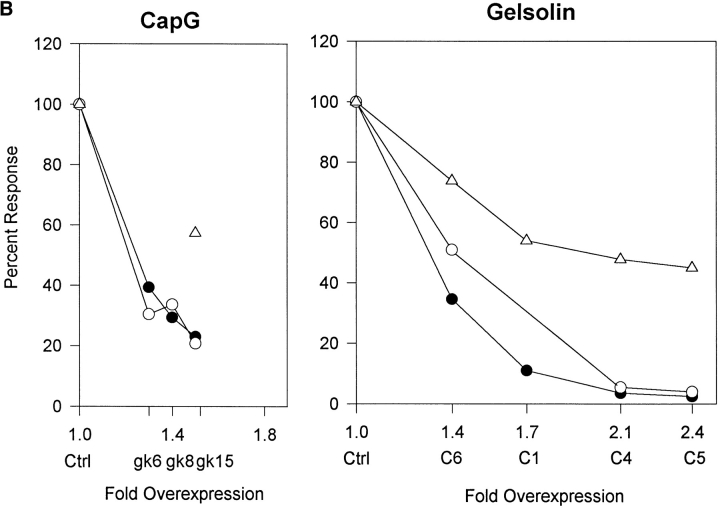
Figure 3.
Effect of gelsolin and CapG overexpression. (A) Ca2+ tracings. Cells were stimulated with 5 μM bradykinin or 20 mM NaF. Tracings were from a representative experiment. Arrows indicate time of agonist addition. Ctrl, mock-transfected cells; C1, gelsolin-overexpressing cells. (B) Comparing the effects of gelsolin and CapG overexpression. Cells were stimulated with 5 μM bradykinin or 20 mM NaF. Ca2+ spike and IP3 generation were measured. The peak response of overexpressing cells was expressed as a percent of ctrl cells exposed to the same stimulus. Results shown were the average of two experiments. Filled circles, Ca2+ signal after bradykinin stimulation; open circles, IP3 generated in response to bradykinin; triangles, Ca2+ signal after NaF treatment.


