
Figure 3.
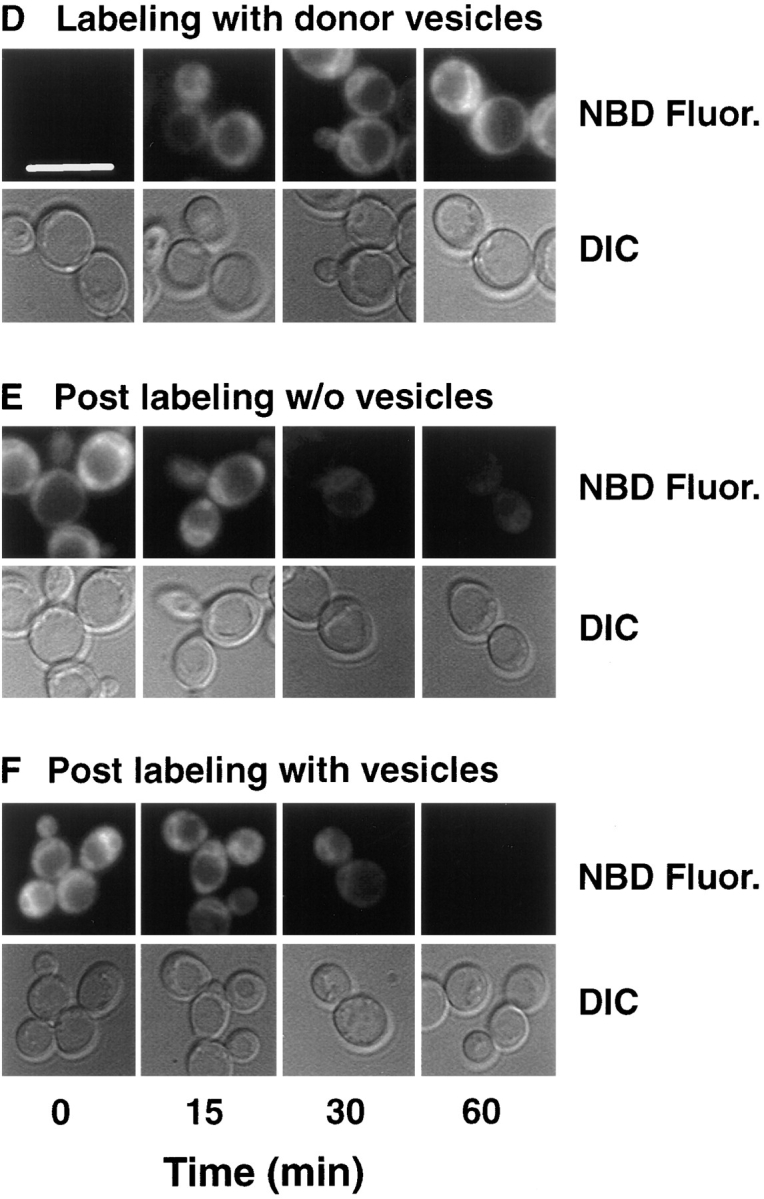

Cellular M-C6-NBD-PE influx and efflux measured by fluorescence microscopy, fluorometry, and quantitative TLC. CRY2 was grown to mid-log phase in SDC medium at 30°C. NY17 (sec6-4) was grown to mid-log in SDC at room temperature (∼23°C). The sec6-4 cells were warmed to 37°C for 30 min before labeling with M-C6-NBD-PE and were treated identically to the CRY2 cells as described below with the exception that they were maintained at 37°C during influx and efflux instead of 30°C. CRY2 cells were pelleted and resuspended in SDC + 2% sorbitol at OD600 = 0.16. Labeling of cells was initiated by the addition of M-C6-NBD-PE–containing donor vesicles (vesicle phospholipid concentration, 50 μM). A 2-ml aliquot was immediately placed in a stirred fluorometer cuvette at 30°C and NBD fluorescence (excitation, 475 nm; emission, 530 nm) was recorded continuously. The remainder were placed in a shaker incubator at 30°C. Aliquots were removed at the indicated times and washed three times in SCNaN3. A small aliquot was removed for fluorescence microscopy and the remainder were extracted, separated by TLC, and quantified by digital imaging of the M-C6-NBD-PE fluorescent spots. After 1 h, the remaining labeled cells were washed three times in ice-cold SDC + 2% sorbitol. Measurement of M-C6-NBD-PE in the cells and medium post labeling was initiated by returning the cells to 30°C in the shaker incubator in the presence or absence of unlabeled DOPC vesicles (50 μM). 2-ml aliquots were removed and placed in the fluorometer for continuous recording as above. Aliquots were removed at the indicated times for fluorescence microscopy, TLC separation and quantification as described above. (A and D) Labeling in the presence of M-C6-NBD-PE donor vesicles. (B and E) Post labeling in the absence of acceptor vesicles. (C and F) Post labeling in the presence of acceptor vesicles. Images in D–F are of CRY2 cells only. The appearance of the sec6-4 cells were similar and are not shown. Solid lines are fluorometer traces adjusted to 100% of maximum signal. Filled symbols refer to extracted, cell-associated M-C6-NBD-PE; open symbols refer to the M-C6-NBD-PE extracted from the supernatant. Circles, CRY2; squares, sec6-4. Bar, 10 μm.