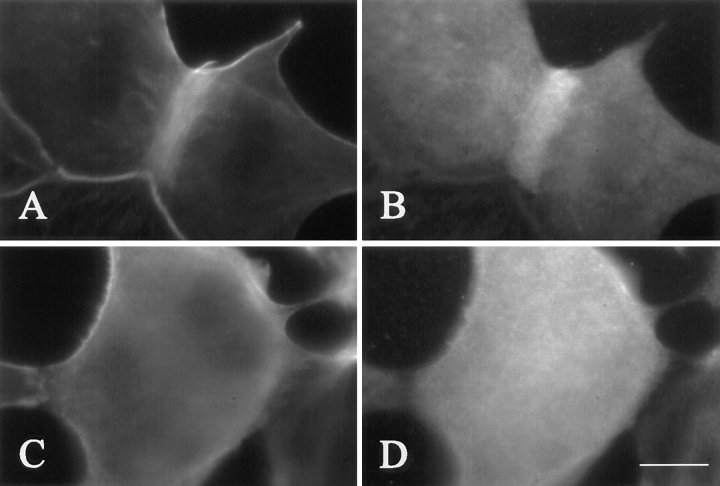
Figure 6.
F-actin (A and C) and myosin II (B and D) localization in control (A and B) and cyclin BΔ90 mRNA injected NRK cells (C and D). Cells were probed with myosin II antibodies and counterstained with fluorescent phalloidin. Control cells display discrete equatorial bands of F-actin and myosin II, while in injected cells these proteins remain diffuse throughout the cortex. Bar, 20 μm.

