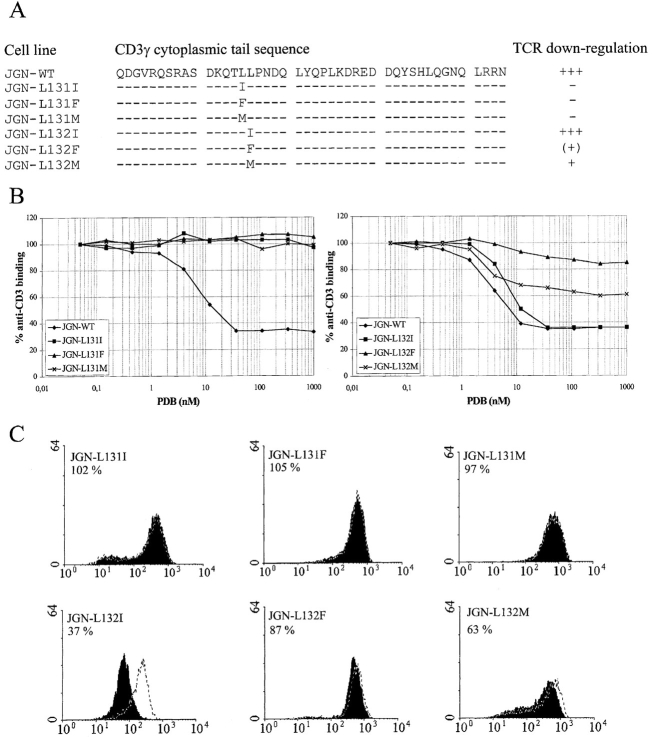
Figure 1.
Requirements to residue 131 and 132. (A) Schematic representation of the amino acid sequences in the cytoplasmic tails of the CD3γ chains expressed in the indicated cell lines and a summation of the results from the TCR downregulation analyses. TCR downregulation was scored according to the percent anti-CD3 binding after incubation with PDB (110 nM) for 1 h: +++, 0–40% anti-CD3 binding; ++, 40–60% anti-CD3 binding; +, 60– 80% anti-CD3 binding; (+), 80–95% anti-CD3 binding; −, >95% anti-CD3 binding. (B) Cells were incubated with different concentrations of PDB for 1 h and TCR downregulation was determined by staining with anti-CD3 mAb and flow cytometry comparing MFI of PDB-treated cells with MFI of untreated cells. (C) FACS® histograms of untreated cells (white, dotted line) and cells treated with 110 nM PDB (black) for 1 h. The cell line and the percent anti-CD3 binding after PDB treatment are given in the upper left corner of each histogram. The ordinate indicates the relative cell number. The abscissa indicates the fluorescence intensity in a logarithmic scale in arbitrary units. MFI of the cell lines stained with irrelevant mAb varied between two and five arbitrary units (data not shown).

