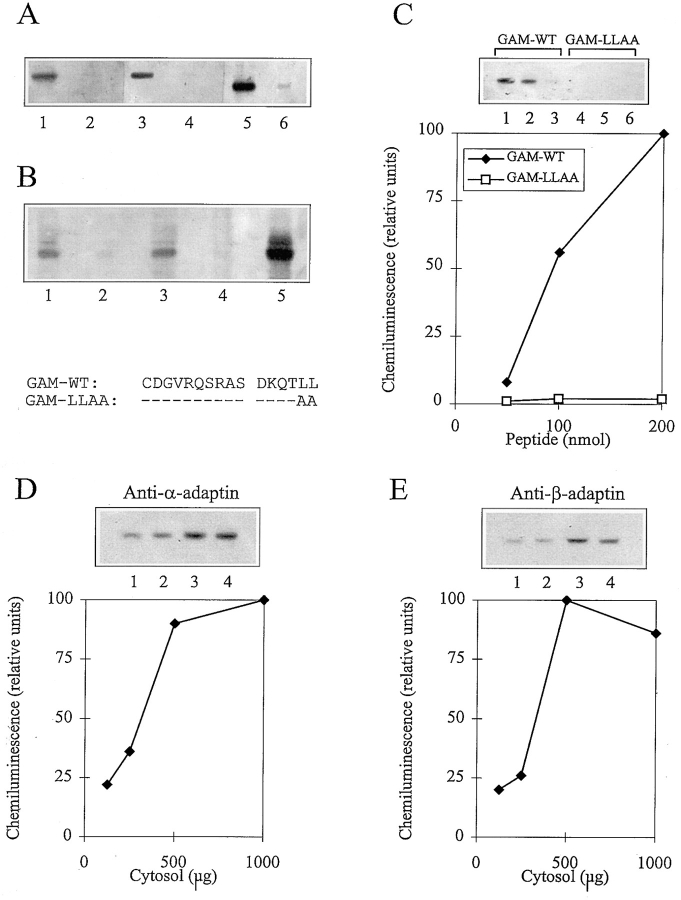
Figure 3.
In vitro binding of AP to CD3γ peptides. (A) Western blots of material from T cell cytosol bound by beads coated with GAM-WT (lanes 1, 3, and 5) and GAM-LLAA (lanes 2, 4, and 6) peptides, and blotted with anti–α-adaptin (lanes 1 and 2), anti–β-adaptin (lanes 3 and 4), and anti–γ-adaptin (lanes 5 and 6) antibodies. The amino acid sequences of the GAM-WT and GAM-LLAA peptides are given below Fig. 3 B. (B) Western blot of material from T cell cytosol bound by beads coated with GAM-WT (lanes 1 and 3) and GAM-LLAA (lanes 2 and 4) peptides with unprocessed T cell cytosol in lane 5 blotted with a mixture of anti–α-adaptin and anti–γ-adaptin antibodies. The beads were either washed three times (lanes 1 and 2) or six times (lanes 3 and 4) before the bound material was eluted. (C) Western blot of material from T cell cytosol bound by beads coated with GAM-WT (lanes 1–3) and GAM-LLAA (lanes 4–6) peptides blotted with anti–α-adaptin antibody. The amount of beads used represented 200 (lanes 1 and 4), 100 (lanes 2 and 5), and 50 (lanes 3 and 6) nmol bound CD3γ peptide. A plot of the bands quantitated by densitometry is given below. The bands are normalized to the band obtained with 200 nmol GAM-WT peptide. (D) Western blot of material from T cell cytosol bound by beads coated with GAM-WT peptides and blotted with the anti–α-adaptin antibody. Increasing amounts (125 [lane 1], 250 [lane 2], 500 [lane 3], and 1,000 [lane 4] μg) of T cell cytosol were used. The amount of beads was constant and represented 200 nmol bound CD3γ peptide. A plot of the bands quantitated by densitometry is given below. The bands are normalized to the band obtained with 1,000 μg T cell cytosol. (E) Western blot of material from T cell cytosol bound by beads coated with GAM-WT peptides and blotted with the anti–β-adaptin antibody. Increasing amounts (125 [lane 1], 250 [lane 2], 500 [lane 3], and 1,000 [lane 4] μg) of T cell cytosol were used. The amount of beads was constant and represented 200 nmol bound CD3γ peptide. A plot of the bands quantitated by densitometry is given below. The bands are normalized to the band obtained with 500 μg T cell cytosol.

