
Figure 3.
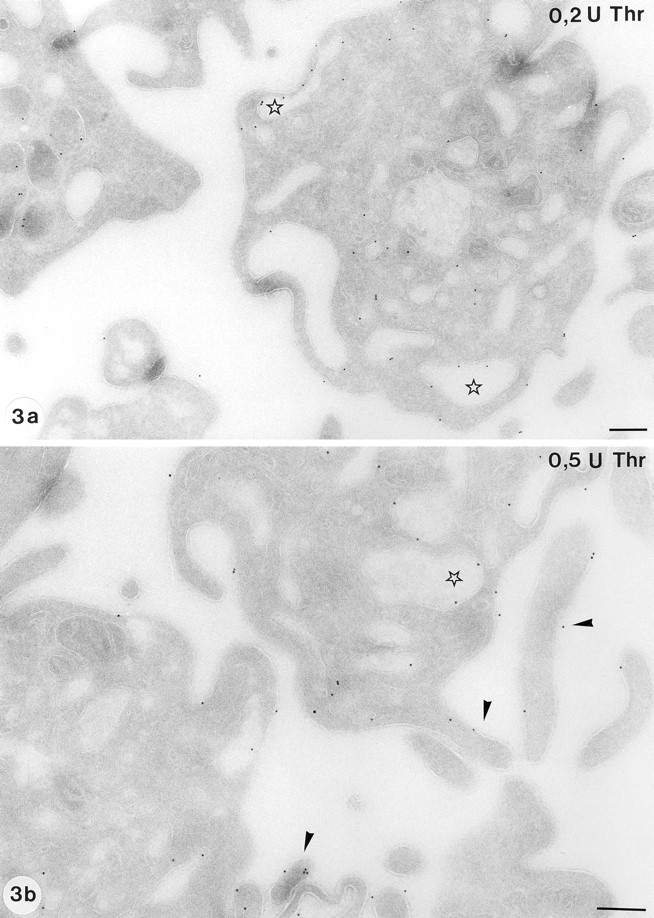
Distribution of GLUT-3 in activated platelets. Activation with both 0.2 U/ml thrombin (a) and 0.5 U/ml thrombin (b) results in a significant loss of the α-granules and a remarkable shape change to a ruffled cell surface. Some platelets had retained α-granules, a finding which was more often encountered at the lower dose of thrombin (a). The translocation of GLUT-3 to the OCS (stars) and to the cell surface is obvious, particularly to the pseudopods. (b, arrowheads). Bar, 250 nm.