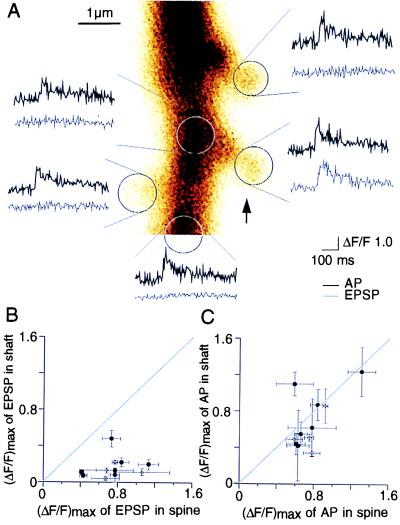
Figure 2.
Calcium transients in spine and dendritic shaft. (A) EPSP-evoked calcium fluorescence transients restricted to a single spine. The dendritic shaft and other spines near the active spine (arrow, lower right) were tested for fluorescence changes. In one active spine, but not in neighboring spines, a calcium fluorescence transient (shaded traces) was recorded after a single EPSP, whereas only a very small fluorescence increase was detected in the adjacent dendritic shaft. In contrast, back-propagating APs evoked fluorescence transients of similar amplitudes and decay times in all spines shown as well as in the dendritic shaft (solid traces). (B) Gradient of EPSP-evoked Ca2+ transient amplitude between spine head and dendritic shaft. Fluorescence changes were recorded simultaneously in shafts and active spines. Graph shows the amplitude of the fluorescence transient (ΔF/F)max evoked by a single EPSP in the dendritic shaft plotted against (ΔF/F)max in the spine (•, CG-1; ⋄, OG-2; error bars represent ± SD, same in C). Unity line represents the points of same fluorescence amplitudes in shaft and spine. Amplitude in the dendritic shaft was 20 ± 10% (n = 11) of the amplitude in the spine head. (C) Ca2+ transients evoked by back-propagating APs in dendritic shaft and spines. Graph shows (ΔF/F)max evoked by a single AP in the dendritic shaft plotted against (ΔF/F)max of a single AP-evoked transient in the spine. Amplitude of an AP-evoked transient in the dendritic shaft was 89 ± 36% (n = 11) of the amplitude in the spine head.

