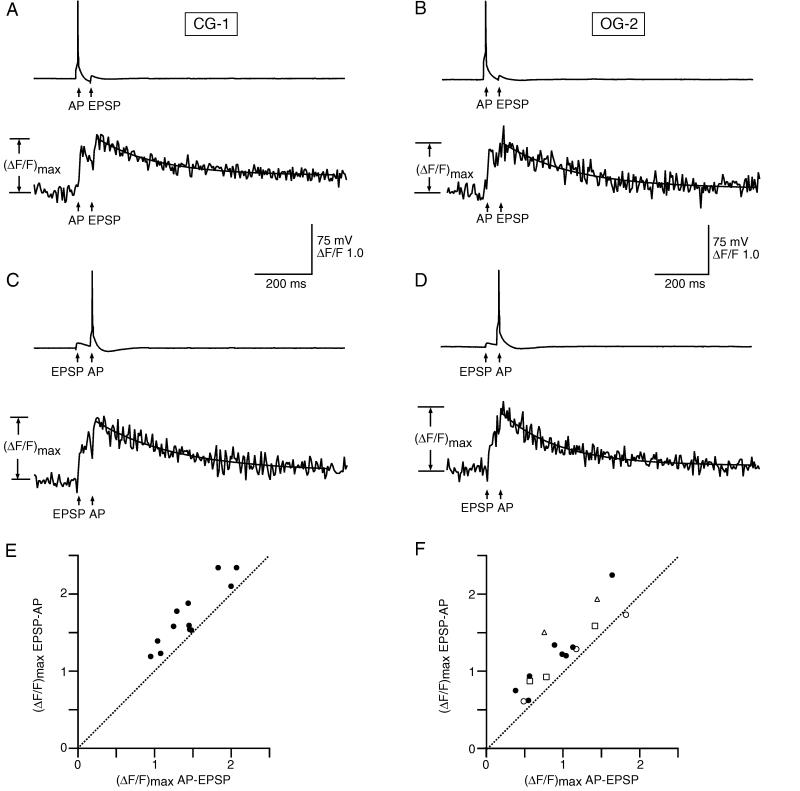
Figure 3.
Summation of spinous Ca2+ transients depends on relative timing of back-propagating AP and EPSP. (A) EPSP preceded by AP (AP–EPSP) examined with CG-1 (100 μM). Upper trace shows whole-cell recording in current clamp mode of a single AP that was followed, 50 ms later, by a single EPSP. Resting membrane potential was −60 mV. Lower trace show the fluorescence transient evoked by this sequence in an active spine head. Fluorescence transient was fitted with a single exponential, yielding a (ΔF/F)max of 1.47. (B) EPSP preceded by AP (AP–EPSP) examined with OG-2 (500 μM). Upper trace shows whole-cell recording of the sequence AP–EPSP and lower trace the fluorescence transient evoked. Resting membrane potential was −62 mV and (ΔF/F)max was 1.12. (C) EPSP followed by AP (EPSP–AP) examined with CG-1. Upper trace shows whole-cell recording of a single EPSP that was followed, 50 ms later, by a single AP. Lower trace shows the fluorescence transient evoked by this sequence in an active spine head where (ΔF/F)max was 1.54. (D) EPSP followed by AP (EPSP–AP) examined with OG-2. Upper trace shows whole-cell recording of the sequence EPSP–AP and the lower trace shows the fluorescence transient evoked by it where (ΔF/F)max was 1.28. (E) Effect of relative timing on EPSP- and AP-evoked fluorescence transients using CG-1 as indicator. Graph shows (ΔF/F)max evoked by the sequence EPSP–AP plotted against (ΔF/F)max evoked by the sequence AP–EPSP. Records with failures (<25%) were excluded. Unity line represents points of same (ΔF/F)max for the two sequences. In each spine examined the (ΔF/F)max depended on the relative timing of EPSP and back-propagating AP. The AP–EPSP sequence evoked a (ΔF/F)max of 1.44 ± 0.36 (n = 14) and the AP–EPSP sequence evoked a (ΔF/F)max of 1.72 ± 0.39. Average ratio of the (ΔF/F)max evoked by the sequence EPSP–AP to that evoked by AP–EPSP was 121 ± 13%. (F) Fluorescence transients measured with OG-2. Graph shows the differences of fluorescence transients evoked by several patterns of paired APs and EPSPs. •, (ΔF/F)max values evoked by sequences where a single AP and a single EPSP were shifted by 50 ms (stimulation protocols shown in B and D). AP–EPSP-evoked (ΔF/F)max was 0.89 ± 0.40 (n = 8) and that evoked by the sequence EPSP–AP was 1.21 ± 0.5. Average ratio of the (ΔF/F)max values evoked by the sequence EPSP–AP to that evoked by the sequence AP–EPSP was 143 ± 32%. (ΔF/F)max values evoked by a burst of two or three EPSPs (at 20 Hz) paired with two or three APs (at 20 Hz) but shifted by 15 ms had an average ratio of 122 ± 21% (○, two EPSPs and two APs, n = 3 and ■, three EPSPs and three APs, n = 3). In three of these experiments, AP-5 was subsequently added, reducing the average ratio to 92 ± 20%. Sequences of three EPSPs (at 20 Hz) followed or preceded by a single AP with a time interval of 15 ms (▵, n = 2) evoked very different (ΔF/F)max values. Average ratio was 179 ± 39%.

