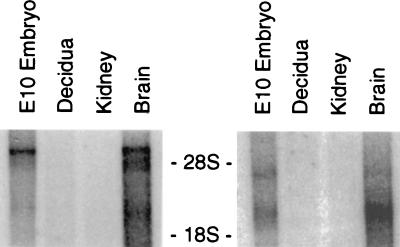
Figure 2.
Northern blot showing PAC1 receptor (Left) and PACAP (Right) mRNA gene expression in E10.5 whole mouse embryos and adult mouse forebrain. Approximately 10 μg poly(A)-selected RNA (except for decidua, 1 μg) was loaded into each well. Adult kidney RNA was used as a negative control. Upper and lower bars indicate the positions of residual 28S and 18S ribosomal RNA (approximately 5 and 2 kb), respectively.

