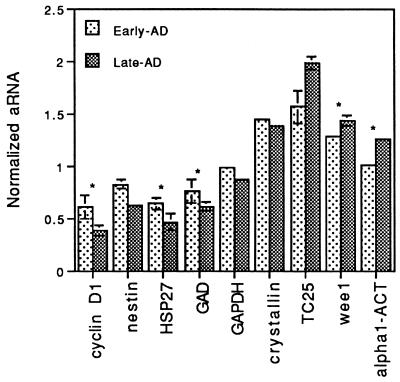
Figure 3.
ANOVA reveals genes that are differentially expressed between early- and late-stages of AD revealed by single-cell aRNA profiling. Five genes with significantly different expression levels (P < 0.05) are marked by asterisks. Four genes showed only marginal changes between early- and late-stage AD (0.05 < P < 0.1). The other 11 genes with no significant change are not shown. Seven single neurons of CA1/subiculum region from each brain of two early- and three late-stage AD patients were analyzed. The data are expressed as an average of normalized signals with standard deviation. Some standard deviations are very small, so they are not visible in the graph.

