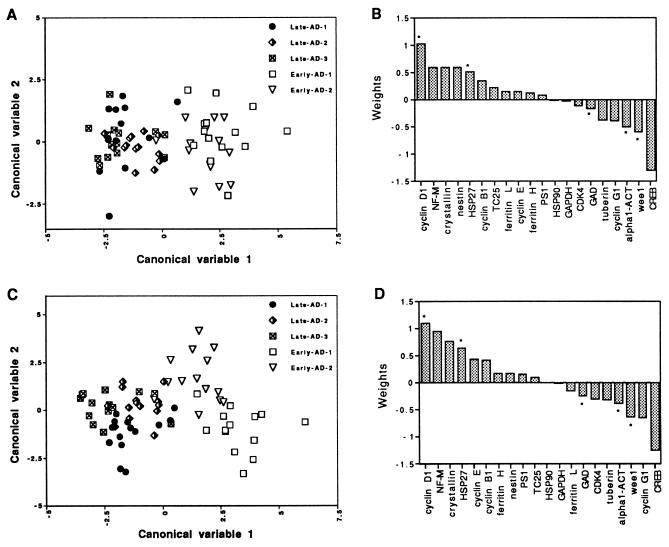
Figure 4.
Multivariate canonical analysis demonstrates separation of cell populations based on summed differences for all cDNAs. The analysis was performed either by grouping five brains based on disease state (two early- vs. three late-stage AD samples) (A) or without using information as to disease state (five groups) (C). When canonical variable 1 is plotted against canonical variable 2 for each cell, there was a clear separation of cells of late-stage AD brains from those in early-stage AD brains in both cases. The weights of 20 genes contributing to canonical variable 1 are presented for analysis based on disease state (B) or brain (D). The five genes with significant changes in expression identified by ANOVA are marked by asterisks. Note the correspondence of genes that differentiate cells in these two analyses based on definition of either disease state or brain.

