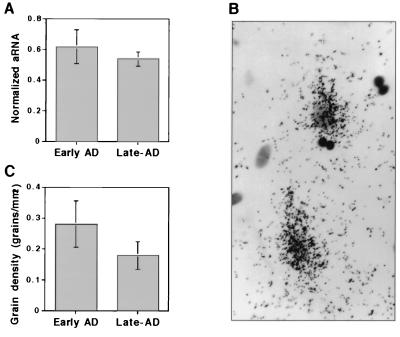
Figure 5.
Analysis of NF-M message in hippocampus by single-cell aRNA profiling and ISH. (A) Comparison of the aRNA levels between two early- and three late-stage AD samples. The data are expressed as mean; the error bars show the standard deviation. (B) ISH was performed on two early- and three late-stage AD brain samples (not all the same samples as used for aRNA profiling). Grains over two neurons of subiculum from a late-stage AD sample is shown. (C) For ISH, quantification of grain density was done for 50 neurons on each section. The data are from an average of 200 neurons for the early-stage AD samples and 50 or 100 neurons for the late-stage AD samples.

