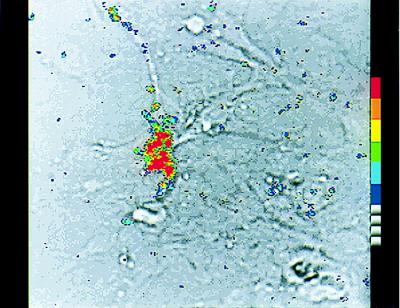
Figure 1.
Real-Time analysis of photons emitted by individual, living GT1–1 cells transfected with a GnRH promoter-driven luciferase construct. A single GT1–1 neuron was transfected by microinjection with a plasmid containing the luciferase coding sequence under the control of the GnRH gene promoter. After 24 h, the culture subsequently was infused with luciferin, and photonic emissions reflective of gene expression were accumulated for a 15-min period. This photograph shows a computer-enhanced image of thresholded photonic events superimposed over the bright-field image of the same microscopic field (×400). The signal from a single photon is amplified and measured as a cloud of photoelectrons, each of which appears as an individual blue blotch in this image. Differences in color here indicate overlapping signals, the extent of which is depicted by the ascending pseudocolor scale shown on the right. The superimposed image shows that an area of concentrated light emissions corresponds to the individual transfected GT1–1 neuron.

