Figure 4.
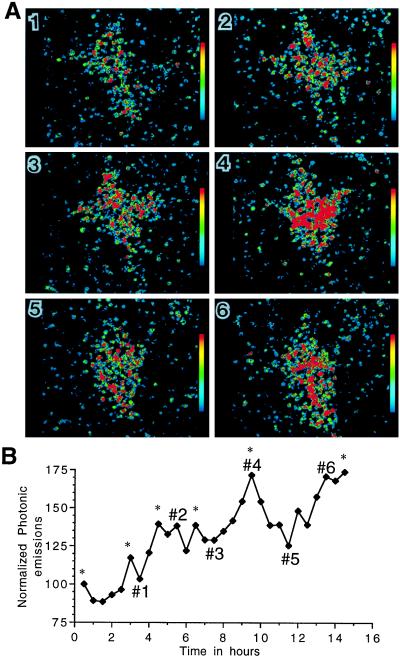
Short-term variations of GnRH gene expression within a single neuron. (A) Computer-enhanced images of thresholded photonic events generated from the same GT1–1 cell (experimental conditions as in Fig. 5) (×800). (B) Normalized photonic emissions for the same cell. The numbers in this profile refer to the corresponding pseudocolor images in A. Details of this experiment are provided in the text of the Results and Discussion section. ∗, Pulses of GnRH gene expression detected by the pc-pulsar program.

