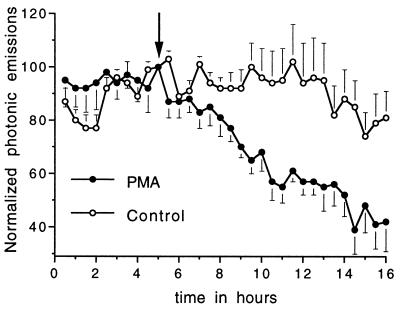
Figure 7.
Attenuation of photonic emissions by a known inhibitor of GnRH gene expression. GT1–1 cells microinjected 24 h earlier were monitored continuously in 30-min windows. PMA (100 nM, •) or vehicle (control, ○) was infused after the first 5 h of the experiment (arrow). Shown are the averaged, normalized, photonic emissions (mean ± SEM) for 11 (PMA) and 5 (control) single cells. Photonic emissions for PMA-treated cells were significantly lower than control values (P < 0.05) beginning 4 h after addition of treatment.

