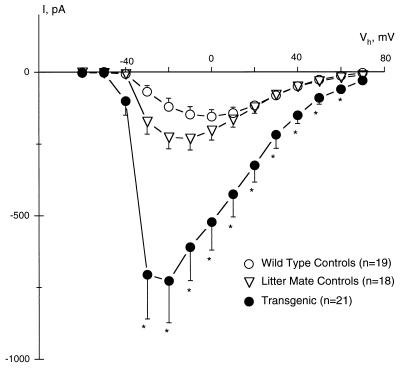
Figure 2.
Current–voltage relationships of Ca2+ currents. No statistical differences in the peak Ca2+ current–voltage relationships were detected between the wild-type controls and the control littermates. However, transgenic myocytes displayed a 5-fold increase in L-type Ca2+ currents compared with wild-type controls. ∗, P < 0.05 between transgenics and wild-type controls.

