
Figure 6.
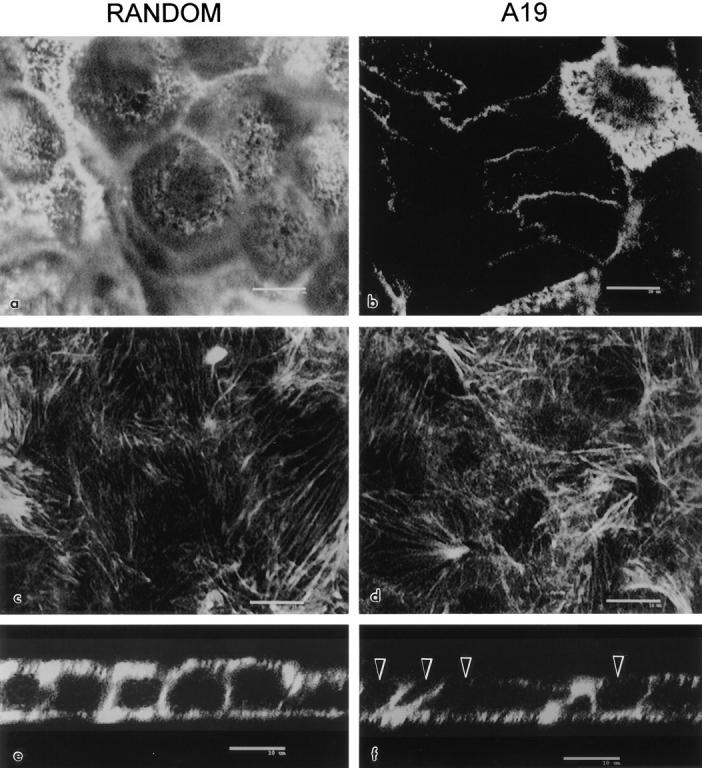
Effect of antisense A19 oligonucleotide on the apical distribution of apical F-actin in CACO-2 cells. The cells were continuously grown in random (a, c, and e; control) or antisense A19 (b, d, and f) oligonucleotides. For this experiment, the cells were plated on glass coverslips and fixed in PFA after 9 d of confluency. The monolayers were detergent permeabilized and processed with FITC–phalloidin. The monolayers were observed under a laser confocal microscope. Confocal optical sections immediately underneath the apical membrane (a and b) or immediately above the basal membrane (c and d) were chosen from the stack of sections in the z axis. The sections in a and c correspond to the same field at different focal planes, and the same applies to the sections in b and d. In each field, a three-dimensional reconstruction section perpendicular to the plane of the monolayer is shown in e and f. Black arrowheads point at F-actin negative apical regions in A19 treated cells. Bars, 10 μm.