
Figure 7.
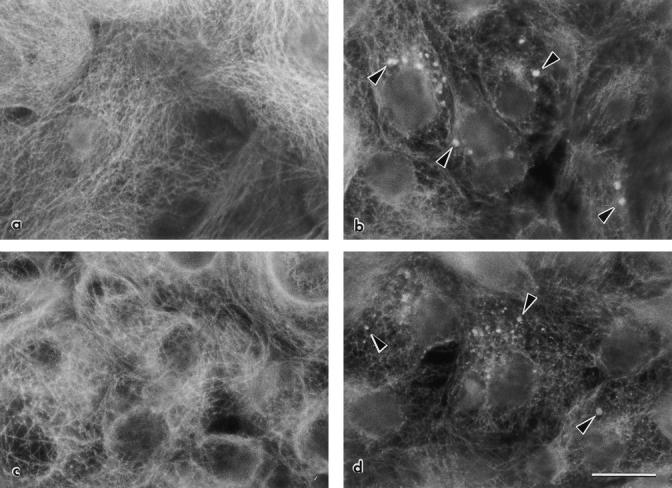
Effect of antisense A19 oligonucleotides on the distribution of tubulin in MCF-10A cells. The cells were continuously grown in random (a; control), random/2 (c; control), antisense A19 (b), or A19/2 (d) oligonucleotides. For this experiment, the cells were plated on laminin-coated glass coverslips and fixed in 3% PFA, 0.1% glutaraldehyde after 5 d of confluency. The cells were permeabilized, fixed, and processed for indirect immunofluorescence with anti-tubulin polyclonal antibody and observed under a standard epifluorescence microscope. Black arrowheads in b and d point to abnormal spheric clusters of tubulin. Bar, 10 μm.