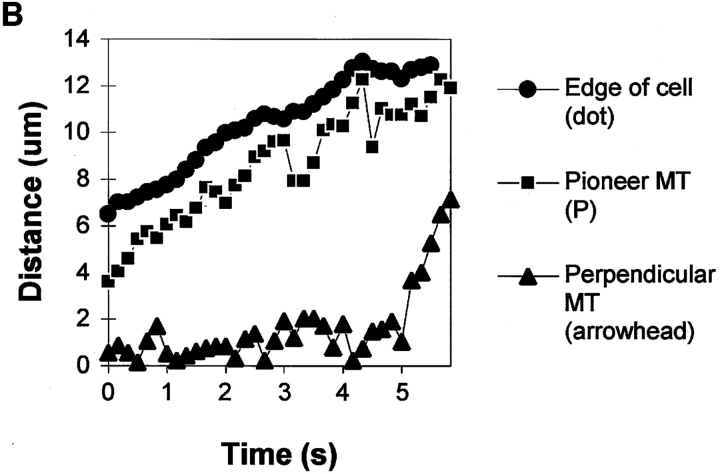
Figure 2.
Dynamics of MTs in the lamella and lamellipodia during protrusion of the leading edge. (A) A series of fluorescence micrographs of the leading edge of a cell that had been injected with X-rhodamine–labeled tubulin, elapsed time in min/sec in the upper right of each panel. The boundary of the cell can be seen in negative image because labeled tubulin subunits are diffusely fluorescent within the cell but not outside of the cell. Before protrusion of the cell edge (times 00:00–00:39) most MTs extend only as far as the one marked with an arrowhead, however some MTs, such as the one marked P, extend closer to the leading edge. As the leading edge advances (times 00:39–04:49), the plus end of the P MT approximately maintains its distance from the leading edge, while the MT at the arrowhead does not extend into the new protrusion until advancement of the leading edge has ceased (times 4:49–5:29). (B) Dynamic life history plots of the plus ends of the MTs marked in A in relation to the position of the cell edge. Distance from the origin (a point at the bottom edge of the micrograph at time 00:00) was plotted against time for images captured at 7-s intervals. The position of the edge was determined from fluorescence intensity linescans perpendicular to and across the leading edge. The “pioneer” MT steadily grows at about 2 μm/min during advancement of the leading edge (∼0–5 min). The proximal perpendicular MT undergoes very little net growth until advancement of the leading edge ceases (∼5 min), whereupon the MT rapidly grows at ∼8 μm/min. Bar, 10 μm.


