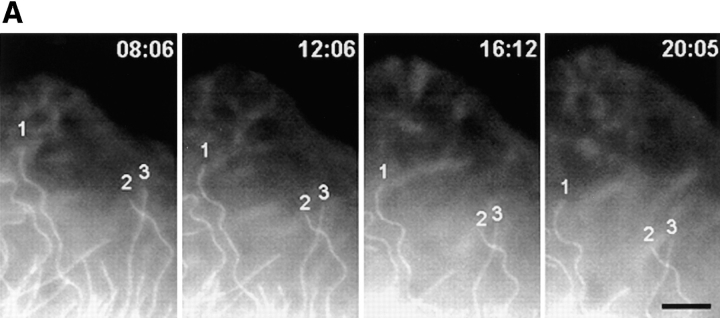
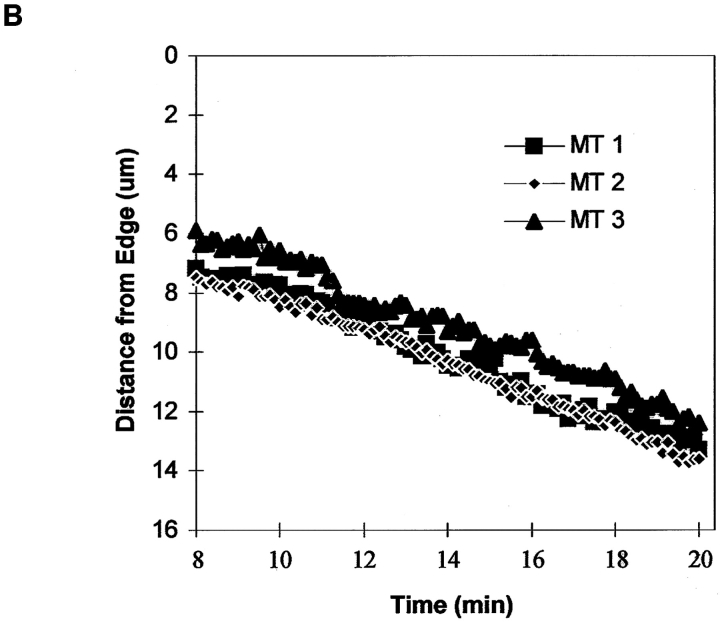
Figure 6.
Rearward flow of assembly-inhibited MT plus ends in the lamella. (A) Selected fluorescence micrographs from a series of a cell that was injected with X-rhodamine–labeled tubulin and then mounted in media containing 100 nM nocodazole to inhibit MT plus end assembly dynamics. Elapsed time after addition of nocodazole shown in the upper right of each panel. The positions of three MT plus ends are highlighted. (B) Dynamic life history plots of the distance of the plus ends of the three MTs marked in A from the leading edge of the cell versus time (images acquired at 7-s intervals). The y axis is inverted for clarity. The MT plus ends do not exhibit typical plus end dynamic instability but instead move slowly away from the cell edge at ∼0.4 μm/min (B). While moving rearward, the MTs maintain characteristic bending patterns (A), indicating that the movement of the plus end is not due to depolymerization. Bar, 10 μm.


