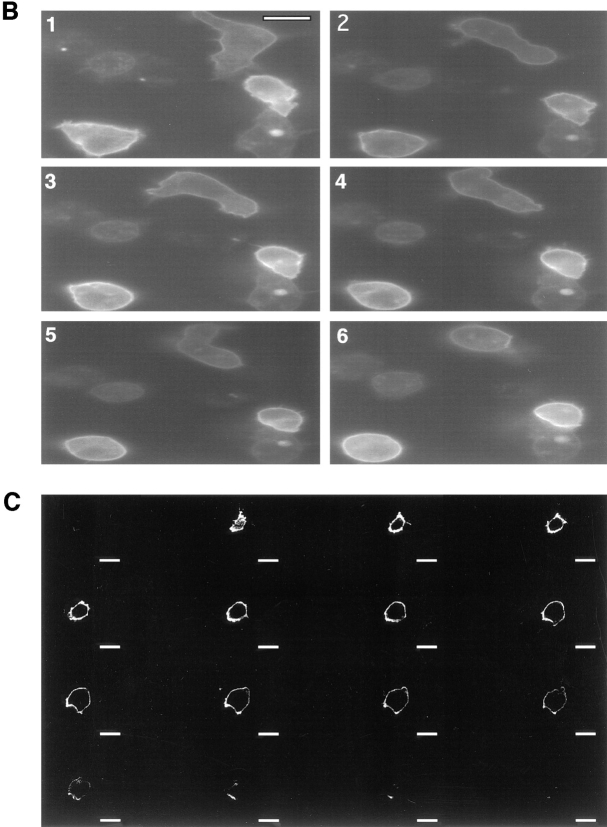
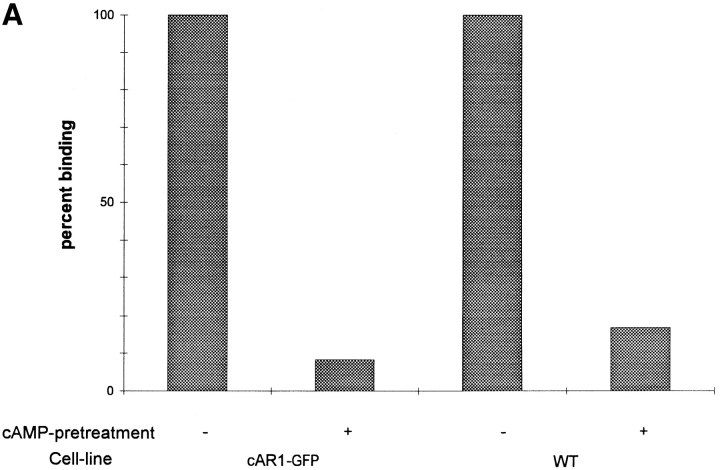
Figure 6.
(A) Cells expressing cAR1-GFP receptors display normal desensitization properties. Wild-type cAR1 cells and cAR1-GFP cells were washed in PB and treated with either buffer (control) or 10−5 M cAMP in the presence of 10 mM DTT for 15 min to induce LLB. After extensive washing, the cells were assayed for their cAMP binding (16 nM [3H]cAMP) in PB (Materials and Methods). The binding was expressed as a percentage of the binding obtained from buffer-treated control cells. (B) Distribution of desensitized cAR1-GFP analyzed through time-lapse fluorescence imaging. All frames are fluorescence images. Frame 1 showed the cell in random movement. cAMP was applied 5 s before frame 2 was taken. Time interval is 1 min between 2 and 4; 90 s between 4 and 6. (C) Z-axis confocal analysis of receptor distribution on desensitized cells. Cells were pretreated with excess cAMP for 5 to 10 min to induce desensitization and then quickly fixed with 4% paraformaldehyde/0.08% Triton X-100. Z-axis sections were taken from the bottom of the cell (substrate adhesion side) to the top surface. Section thickness: 0.5 μm; frame distance: 1.0 μm. Bars, 10 μm.


