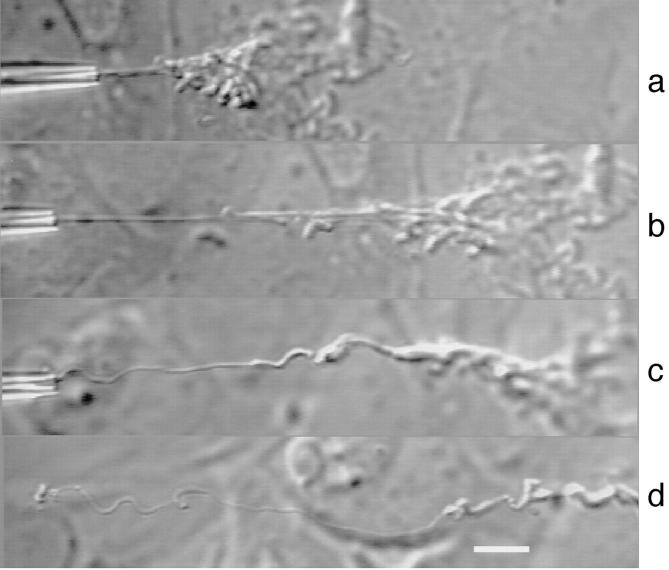
Figure 2.
The state of the chromosome after different cycles of deformation– release, when the pipette is brought back near the cell. (a) ε = 10, similar to Fig. 1 e; (b) ε = 15; (c) ε = 20; and (d) ε = 55. During the last cycle (bottom), the chromosome broke and was released from the pipette. The shape observed is stable over at least 1 h. Bar, 10 μm.

