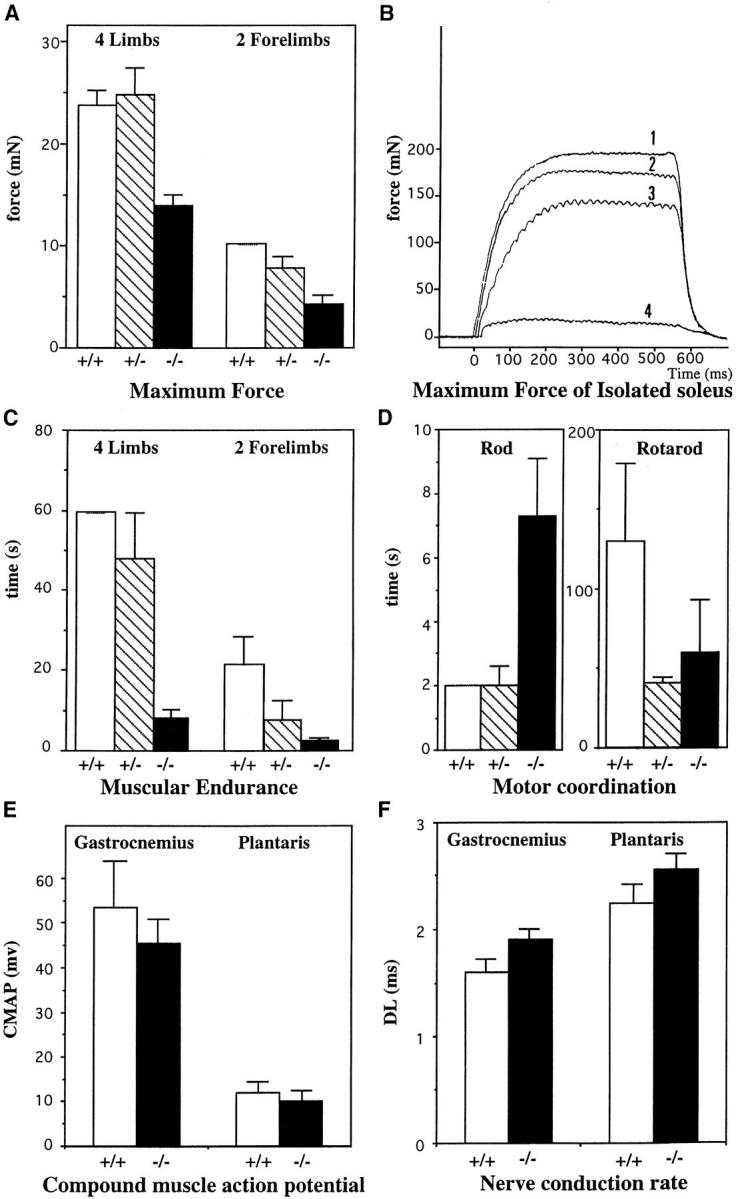
Figure 9.

Analyses of muscular performances on control animal Des +/+ (white), heterozygous Des +/− (hatched) and homozygous Des −/− (black). (A) The maximum force developed by the mice was measured by pulling the mouse backwards by the tail until the bar was released. Animals were allowed to hold the bar linked to a dynamometer either with all four limbs or with the two forelimbs. Results are expressed in mN. (B) The maximum force developed by isolated muscle was measured on soleus from 2- (curve 1: Des +/+; curve 3: Des−/−) and 5-mo-old mice (curve 2: Des +/+; and curve 4: Des −/−). (C) The muscular endurance was analyzed by measuring the time that animals could hold onto a 32-g bar, either with all four limbs (4L) or with the two forelimbs (2L). Results are expressed in s. (D) Motor coordination: performances were measured either by measuring the time that mice need to cross a rod or by putting the mice on a rotating apparatus. Capacity of Des −/− mice are considerably modified. (E) CMAP measured in gastrocnemius and plantaris muscles from 5-mo-old mice. Results are expressed in mV. (F) Nerve conduction rate measured in gastrocnemius and plantaris muscles from 5-mo-old mice. The DL is given in ms. Data are the means ± standard errors computed from each set of experiments.
