
Figure 2.
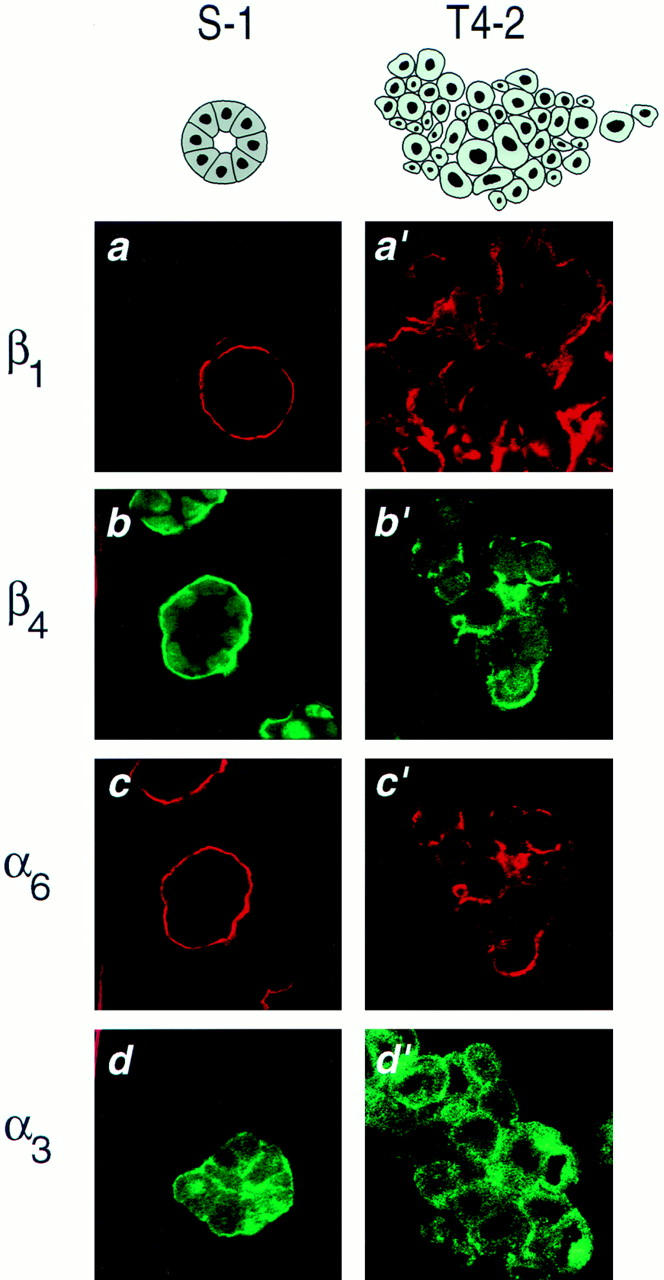
Immunofluorescence characterization of integrins in the HMT-3522 cells in 3-dimensional cultures. (a–d) Cryosections of S-1 acini and (a′–d′) T4-2 colonies, immunostained and examined by confocal fluorescence microscopy for localization of β1- (a and a′), β4- (b and b′), α6- (c and c′), and α3-integrin (d and d′) localization: β1-, β4-, and α6-integrins were targeted to the cell-ECM junction in the S-1 acini (a–c), in contrast, in T4-2 colonies (a′–c′) this polarized-basal distribution was lost. S-1 acini exhibited basolateral α-3 integrins (d), whereas T4-2 colonies (d) demonstrated disorganized plasma membrane and cytosolic expression of this integrin. All cultures were analyzed after 10–12 d inside EHS. Bars: (a–d and a′–d′) 16 μm.