
Figure 3.
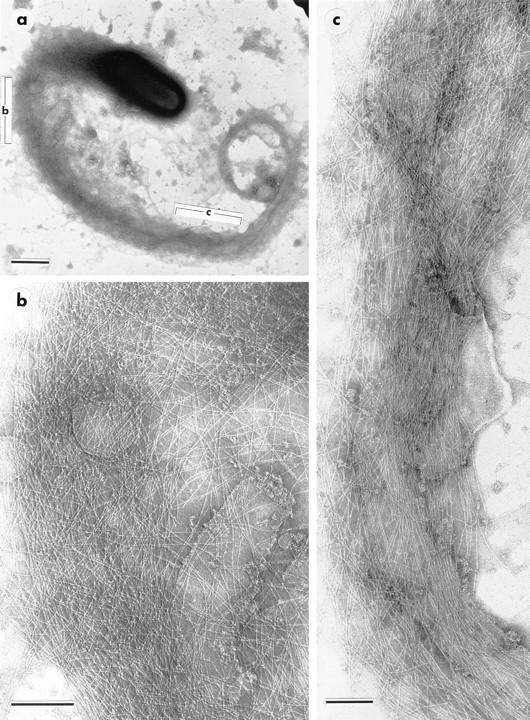
Isolated PtK2 pseudopodium (a) indicating regions (bracketed) shown at higher magnification in b and c. The component of axial filaments in b is best revealed by viewing the micrograph at a glancing angle. Bars: (a) 1 μm; (b and c) 0.2 μm.
Official websites use .gov
A
.gov website belongs to an official
government organization in the United States.
Secure .gov websites use HTTPS
A lock (
) or https:// means you've safely
connected to the .gov website. Share sensitive
information only on official, secure websites.
Isolated PtK2 pseudopodium (a) indicating regions (bracketed) shown at higher magnification in b and c. The component of axial filaments in b is best revealed by viewing the micrograph at a glancing angle. Bars: (a) 1 μm; (b and c) 0.2 μm.