
Figure 5.
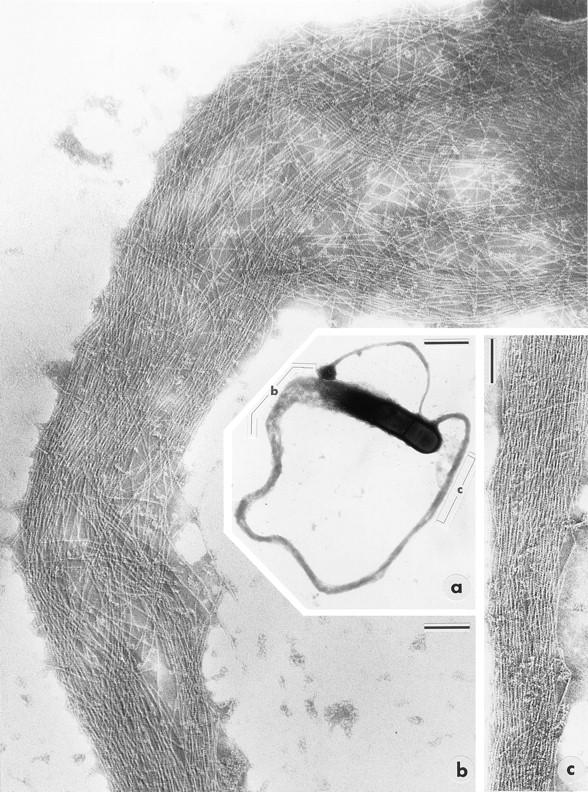
Isolated macrophage pseudopodium (a) indicating regions (bracketed) shown at higher magnification in b and c. Note splaying of long, axial filaments into the region proximal to the rear of the bacterium (top right in b). Bars: (a) 1 μm; (b and c) 0.1 μm.