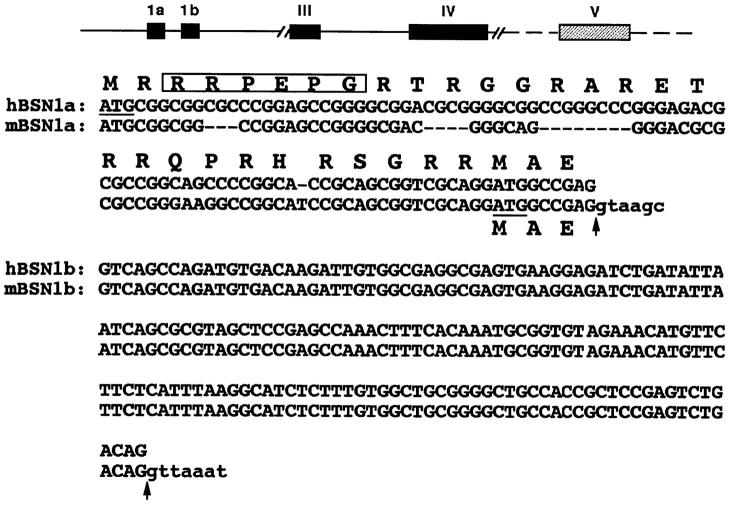
Figure 2.
Sequence relation between the two forms of basonuclin. Shown is a schematic of the mouse gene structure (top) and the two basonuclin forms (bottom). Hatched bars denote regions not fully sequenced; intron sizes are unknown. Human BSN1a sequence shown is from Tseng and Green (1992); the mBSN1a RNA is likely to use a downstream ATG for translation (underlined). The hBSN1b sequence, determined from a full-length cDNA, differs only in its 5′ sequence from hBSN1a. It is possible that an ATG shared by 1a and 1b is used for translation, since in vitro transcription/translation yields a >110-kD protein. The sequences encoding the unique segments of BSN1a and BSN1b are located on individual exons. Arrows denote splice sites; small case nucleotides represent intron sequences; putative mitochondrial localization sequence is boxed.

