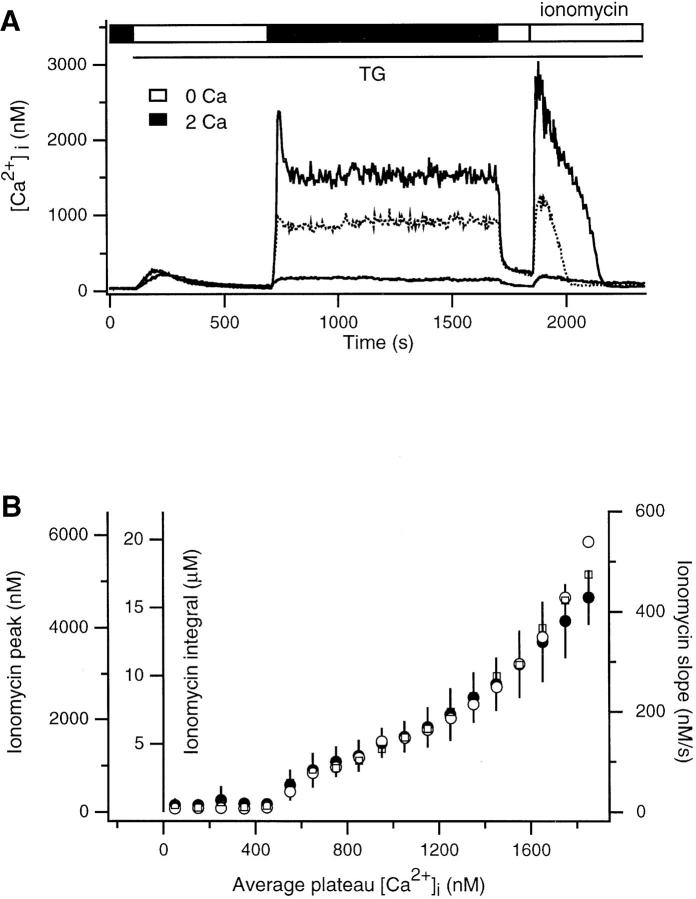
Figure 2.
Ca2+ dependence of uptake by the TG-insensitive Ca2+ store. (A) Cells were stimulated as in Fig. 1 B to load the TG- insensitive store. The loading period was terminated by removing extracellular Ca2+, and 4 μM ionomycin was added subsequently to assay store content. The responses of three single cells from one experiment are superimposed. (B) Store content plotted as a function of the average magnitude of the Ca2+ plateau for individual cells. Three measures of store content are plotted: the peak [Ca2+]i (•), the maximum rate of [Ca2+]i rise (○), and the integral of released Ca2+ (corrected for clearance rate, see Materials and Methods; □) in response to ionomycin. Results were obtained from 964 cells in 11 experiments and binned into 100-nM intervals of [Ca2+]i.

