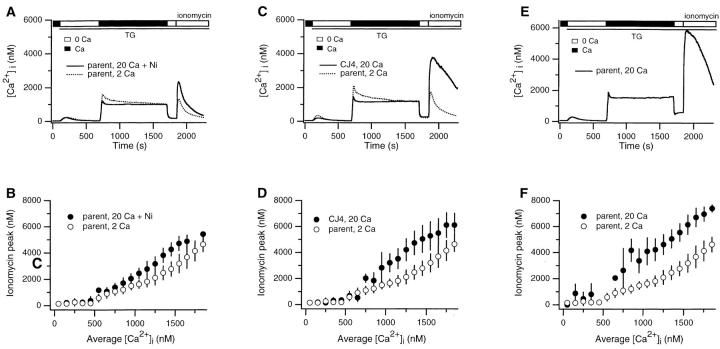
Figure 3.
The TG-insensitive store senses Ca2+ near CRAC channels. Experimental conditions and analysis were identical to Fig. 2 with the exception that conditions during the plateau phase were varied. (A and B) 2 mM Ca2+ (dotted trace, ○) or 20 mM Ca2+ with 8 mM Ni2+ (solid trace) or 5–10 mM Ni2+ (•) was added to create plateaus of comparable magnitude. (C and D) 2 mM Ca2+ was applied to parental Jurkat cells (dotted trace, ○), and 20 mM Ca2+ was applied to CJ-4 cells (solid trace, •), a Jurkat mutant with reduced CRAC channel function. (E and F) 20 mM Ca2+ was added (solid trace, •) and compared to the response to 2 mM Ca2+ (○, data from Fig. 2 B). Graphs show mean values ± SD: parent cells, 2 mM Ca2+ (964 cells/11 experiments), 20 mM Ca2+ + Ni2+ (604/6), 20 mM Ca2+ (439/3); CJ-4 cells, 20 mM Ca2+ (900/5). Each of the experiments in A, C, and E represents the average response of ∼300 cells.

