Figure 4.
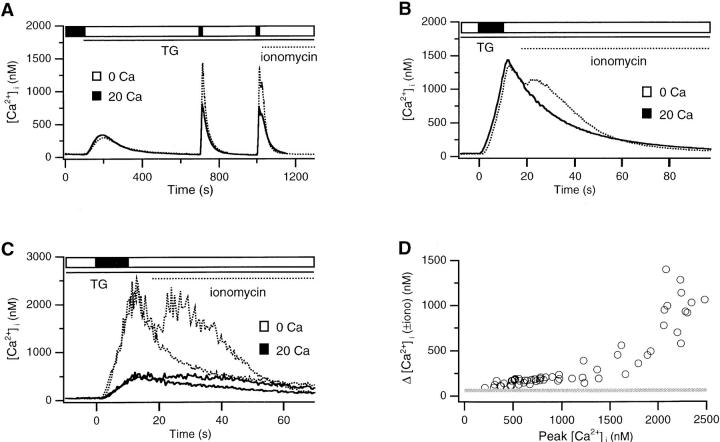
Rapid loading of the TG-insensitive store. (A) After depletion of the TGsensitive store, 20 mM Ca2+ was added twice for 8 s (solid trace) or 10 s (dotted trace) in two separate experiments. 5 s after the second application of Ca2+, 4 μM ionomycin was added to assay the content of the TG-insensitive store. Each trace is the average of 40 cells. (B) The initial falling phases of the two 10-s transients from (A) are aligned on an expanded timescale. Ionomycin releases stored Ca2+ after the second transient (dotted trace). (C) Data from two cells displaying either a high (dotted trace) or a low (solid trace) response to ionomycin. For each cell, the initial falling phases of the two transients are aligned as in B to enable detection of the Ca2+ released by ionomycin. (D) Ca2+ dependence of store loading in response to brief Ca2+ transients. Cells from four experiments were analyzed as described in C. The first pulse was subtracted from the second one, and the peak of the resulting “ionomycin release transient” was taken as a measure of store loading. This is plotted as a function of the peak [Ca2+]i during the second transient before ionomycin. The shaded bar shows the range of ionomycin response (40– 80 nM) observed in resting cells before store loading.

