Figure 5.
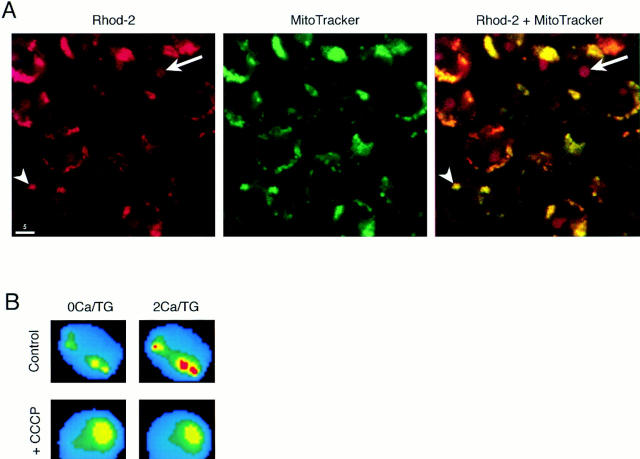
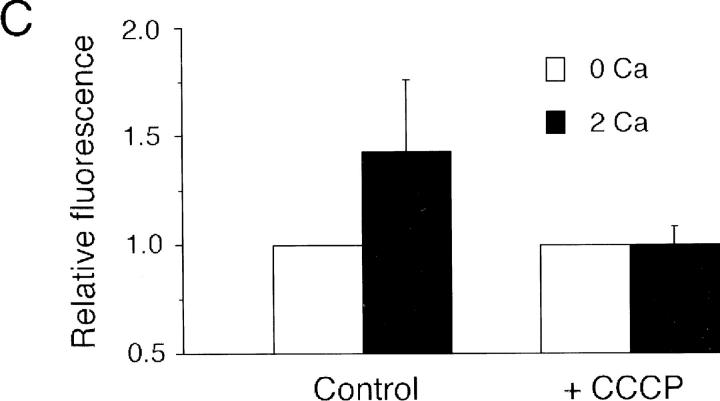
Rhod-2/AM labels mitochondria and reports changes in intramitochondrial [Ca2+]. (A) Confocal micrographs of Jurkat cells after incubation with rhod-2/AM (left) or MitoTracker™ Green FM, a mitochondrial marker (center). Rhod-2 labeling of mitochondria (arrowhead) is easily distinguished from labeling of the nucleolus (arrow). An overlay of the two images demonstrates specific colocalization of the two dyes in the mitochondria (right). (B) Mitochondrial Ca2+ imaging with rhod-2. In these pseudocolored video microscopic images of a single TG-treated cell, rhod-2 fluorescence in the mitochondria increases within 3 min after readdition of 2 mM Ca2+ (top). 1 μM CCCP prevents the fluorescence increase in another cell (bottom). Warmer colors indicate higher rhod-2 fluorescence. (C) Quantification of rhod-2 fluorescence in “hot spots” in cells of the experiment shown in B. Hot spot fluorescence was measured before and 3 min after readdition of 2 mM Ca2+. The fluorescence intensity before readdition was normalized to one. 35 cells (control) and 28 cells (+CCCP) were analyzed. Error bars reflect standard deviations. Bar, 5 μm.


