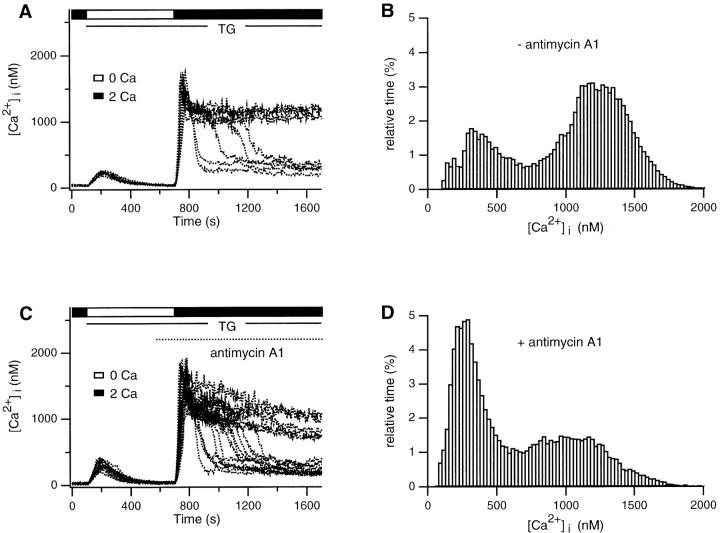
Figure 9.
Abrupt transitions of [Ca2+]i in single cells. Data were obtained from the experiments shown in Fig. 7 A. (A) Superimposition of control responses from eight cells shows rapid transitions from a high Ca2+ to a low Ca2+ plateau. (B) An amplitude histogram from period after Ca2+ readdition in the experiment shown in A is bimodal, indicating that cells spend most of their time in one of two well-defined states. (C) 2 μM antimycin A1 increases the frequency of transitions from the high to low Ca2+ states. (D) Amplitude histogram from period after Ca2+ readdition in the experiment shown in C. The high Ca2+ peak is somewhat lower than in the control cells, probably due to the slow decline in the high Ca2+ plateau illustrated in C.

