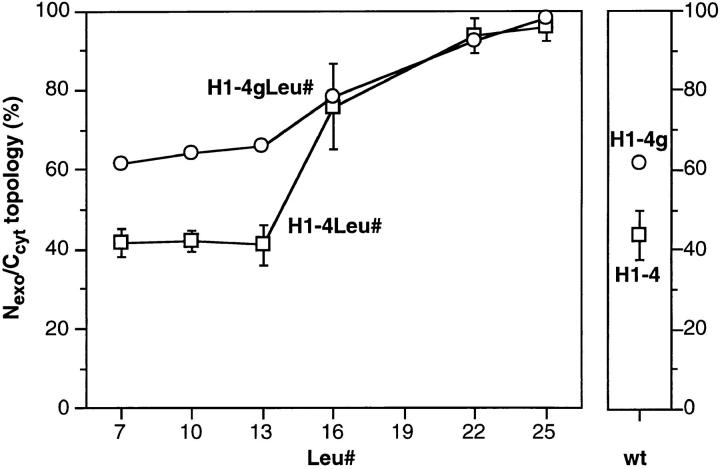
Figure 7.
Quantitation of the topology of the constructs H14Leu# and H1-4gLeu#. The insertion experiments including those shown in Fig. 6 were quantified by densitometric scanning of the fluorographs. The fraction of once glycosylated protein, i.e., with Nexo/Ccyt orientation, is presented as percent of the total of all forms as described in the legend to Fig. 5. The values for H14Leu# represent the mean of three or more experiments with standard deviations; those for H1-4gLeu# represent single determinations performed simultaneously.

