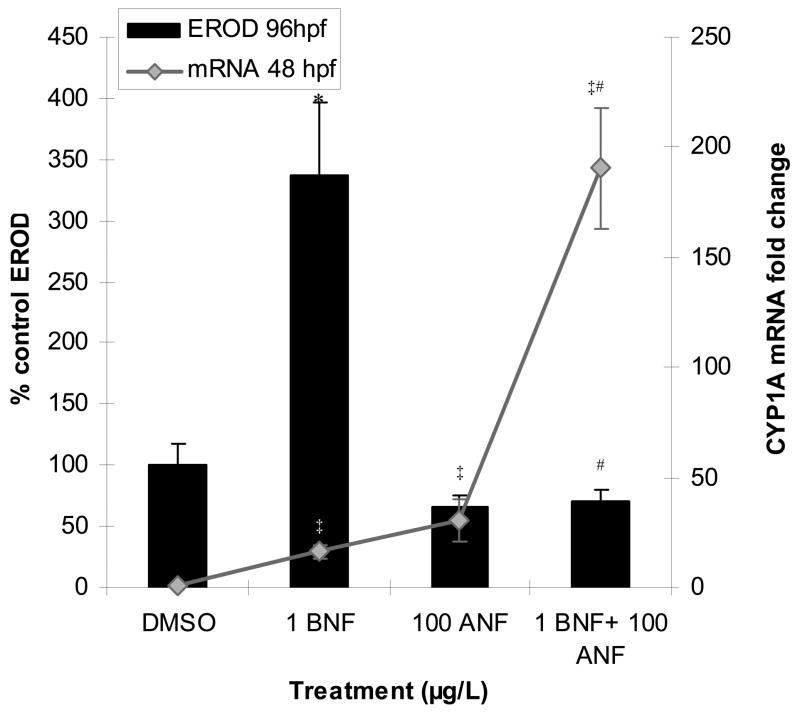
Figure 4.
CYP1A EROD activity vs. CYP1A mRNA induction. BNF induction of EROD activity (96 hpf) is inhibited by ANF while mRNA induction (48 hpf) is synergistically enhanced. A “#” indicates a synergistic interaction (ANOVA interaction term p ≤ 0.05). A “*” indicates a significant difference from control among EROD data, and “‡” indicates a significant difference from controls among mRNA data (p ≤ 0.05). Data are presented as mean ± S.E.; EROD n = 3 replicates of pooled embryos and is representative of 75 larvae. mRNA n ≥ 12 replicates of pooled embryos.

