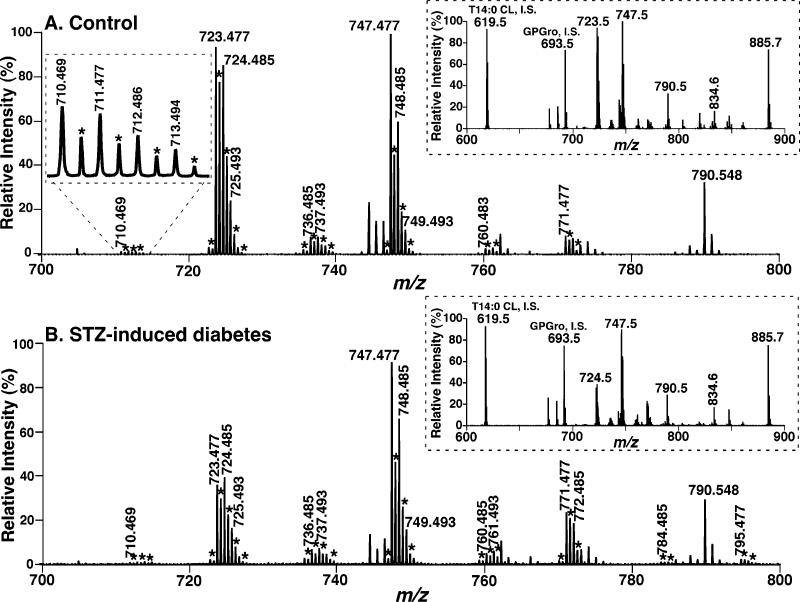
Figure 1.
Expanded negative-ion electrospray ionization mass spectra of myocardial lipid extracts from STZ-treated diabetic and control mice. Myocardial lipid extracts of control (panel A) and diabetic (after STZ treatment for 6 weeks, panel B) mice were prepared by a modified Bligh and Dyer procedure as described under Materials and Methods. Negative-ion ESI mass spectra were acquired by using a QqTOF mass spectrometer as described under Materials and Methods. Both spectra displayed have been normalized to the CL internal standard (see insets). The asterisks indicate the majority of the doubly charged CL plus-one isotopologues whose ion peak intensities are utilized to quantify individual CL molecular species as described under Materials and Methods. Other unlabeled ion peaks correspond to deprotonated molecular species of other anionic phospholipids and ethanolamine glycerophospholipids. The insets on the right side show the extended mass spectra that display the internal standards and other major anionic phospholipids. The inset on the left side of panel A shows an enlarged ion cluster that displays the peak resolution and peak shape of the ions and their isotopologues of low abundance CL molecular species.

