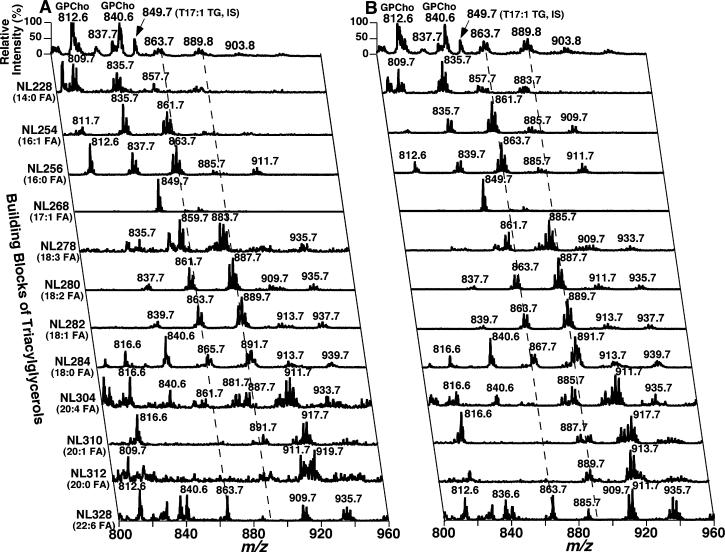
Figure 9.
Two-dimensional mass spectrometric analyses of triacylglycerol molecular species profiles in myocardial lipid extracts of WT and ob/ob mice at 2 months of age. Lipid extracts from WT and ob/ob mice were prepared by a modified Bligh and Dyer procedure as described under Materials and Methods. Two-dimensional MS analyses of TG molecular species were performed in the positive-ion mode in the presence of a small amount of LiOH. Neutral loss (NL) scanning of all naturally occurring aliphatic chains (i.e., the building blocks of TG molecular species) of myocardial chloroform extracts of WT (left panel) and ob/ob mice (right panel) at 2 months of age was utilized to identify the molecular species assignments, deconvolute isobaric molecular species, and quantify TG individual molecular species by comparisons with a selected internal standard [i.e., T17:1 TG, shown in the neutral loss (NL) scanning trace of NL268.2]. Each MS/MS trace of the two-dimensional ESI mass spectra was acquired by sequentially programmed custom scans operating under Xcalibur software as shown in Figure 8. All mass spectral traces were displayed after being normalized to the base peak in each trace.

