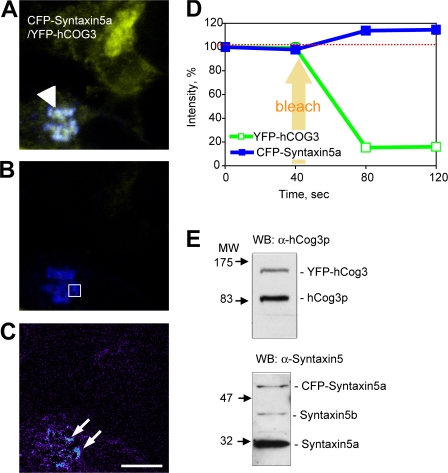
Figure 5.
FRET analysis of the COG– Syntaxin5a interaction in vivo. (A–C) HeLa cells stably expressing YFP-hCog3 were transfected with the plasmid encoding CFP-Syntaxin5a. 24 h after transfection, physical interaction between CFP-Syntaxin5a and YFP-hCog3p was analyzed by the FRET protocol using a confocal microscope. CFP-Syntaxin5a signal before (A) and after (B) bleaching with a 514-nm laser (YFP bleach) and FRET ratio image (C) are shown using RGB (A and B) and rainbow (C) palettes. Bar, 10 μm. (D) CFP and YFP fluorescence before and after bleaching (n = 12) was calculated for the Golgi subregion (B, square). Both Golgi (A, arrowhead) and FRET-positive Golgi subregions (C, arrows) are indicated. Red dashed line is a baseline of CFP-Syntaxin5a signal before YFP-hCog3 bleaching. (E) Total cell lysates of HeLa cells stably expressing YFP-hCog3 or CFP-Syntaxin5a were analyzed by Western blot with antibodies indicated.

