Figure 1.
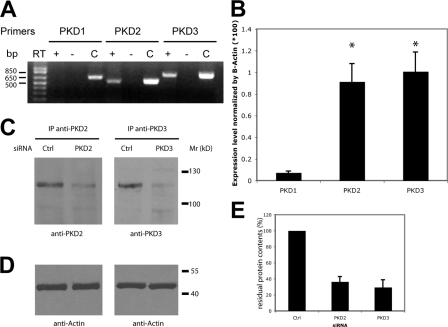
Relative expression of PKD isoforms in HeLa cells and their depletion by siRNA. (A) Analysis of mRNA expression by RT-PCR shows that PKD2 and PKD3 are the only PKD isoforms expressed in HeLa cells. RT-PCR reaction without the reverse transcriptase (RT−) was used as a negative control and PCR with the corresponding PKD cDNA (C) as a positive control. (B) Quantitative real-time RT-PCR analysis was performed on RNA extracted from HeLa cells. Bars represent the mean (±SD) of the relative mRNA expression of each PKD isoform compared with the average expression of β-actin. *, P < 0.01 compared with PKD1. (C) PKD2 and PKD3 protein levels in HeLa cells transfected with the indicated siRNA were detected by immunoblot analysis after immunoprecipitation from 100 μg of cell lysate using anti-PKD2 and anti-PKD3 antibodies, respectively. (D) β-Actin expression in the lysates used for immunoprecipitation was monitored as a loading control. (E) The effect of PKD2 and PKD3 siRNA was quantified by densitometry and normalized to the expression of PKD2 and PKD3, respectively, in cells transfected with control siRNA.

