
Fig. 11.
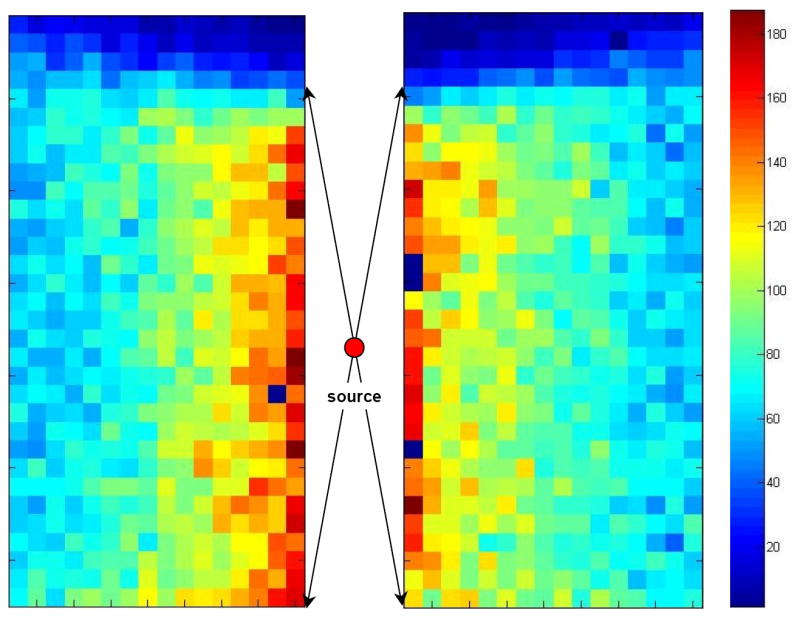
2-D plot of the number of coincidence events in each pad or hit map from the first (right) and second (left) silicon detectors. The source is located at few millimeters below from the center of FOV.
Official websites use .gov
A
.gov website belongs to an official
government organization in the United States.
Secure .gov websites use HTTPS
A lock (
) or https:// means you've safely
connected to the .gov website. Share sensitive
information only on official, secure websites.
2-D plot of the number of coincidence events in each pad or hit map from the first (right) and second (left) silicon detectors. The source is located at few millimeters below from the center of FOV.