
Fig. 4.
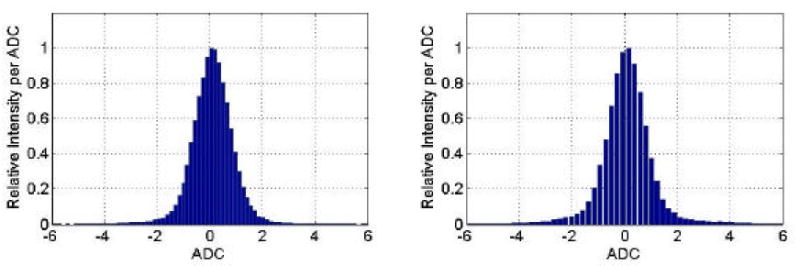
Histograms of common mode noise from the first (left) and second (right) silicon detectors. The distributions are Gaussian-shaped with zero mean and 1.53 and 1.55 ADC FWHM from the first and second silicon detectors, respectively.
Official websites use .gov
A
.gov website belongs to an official
government organization in the United States.
Secure .gov websites use HTTPS
A lock (
) or https:// means you've safely
connected to the .gov website. Share sensitive
information only on official, secure websites.
Histograms of common mode noise from the first (left) and second (right) silicon detectors. The distributions are Gaussian-shaped with zero mean and 1.53 and 1.55 ADC FWHM from the first and second silicon detectors, respectively.