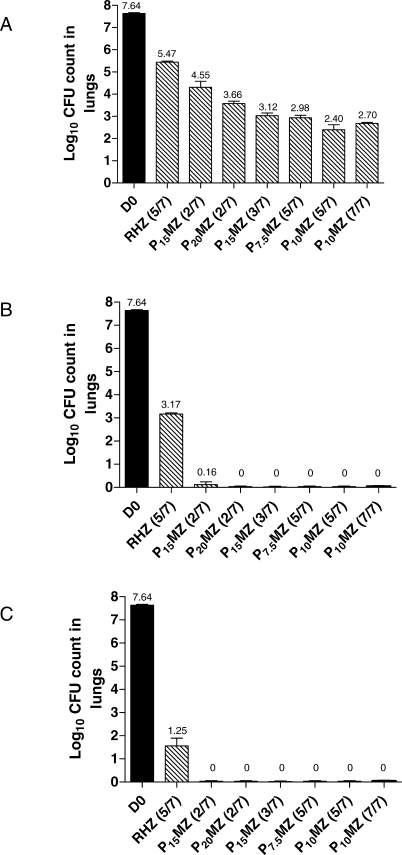
Figure 1. Lung Log10 CFU Counts in M. tuberculosis–Infected Mice.
CFU counts at treatment initiation (D0) and (A) after 1 mo, (B) after 2 mo, and (C) after 3 mo of treatment. Data are presented as means and standard error (error bars) (n = five mice per time point). H, isoniazid; M, moxifloxacin; Z, pyrazinamide; R, rifampin; P, rifapentine.

