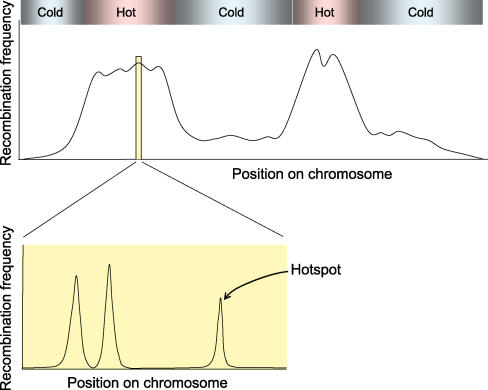
Figure 2. Recombination Frequency Mapped at Different Resolutions.
The upper plot is a highly schematic representation of recombination distribution along an entire chromosome, showing alternating domains of relatively higher (“hot”) and relatively lower (“cold”) recombination activity. Such domains are megabase pairs long in mammals and 20–100 kb long in yeast. When examined at higher resolution, distinct hot spots are revealed, separated by DNA segments where little, if any, recombination occurs (lower plot). Recombination hot spots in mammals are typically ∼1–2 kb wide, separated by tens of kilobases of recombinationally suppressed DNA. For examples of real recombination distributions, see [6,25,26].

