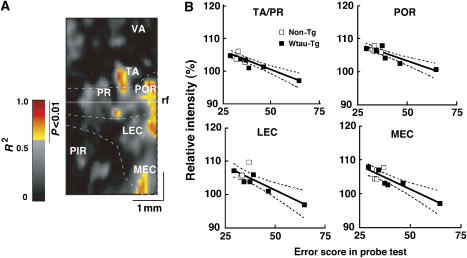
Figure 5.
Correlation between regional neural activity and memory performance. (A) Pseudocolored flat map showing the coefficients of determination (R2) of MEM signals in different parahippocampal regions as a function of memory performance score in aged mice. This map is based on flat maps showing the regional distribution of MEM signals during place learning. The red-to-yellow–colored areas in the map represent areas showing significant negative correlation between neural activity and memory performance (P<0.01, Pearson's correlation test). (B) Correlation curves for temporal area (TA), perirhinal area (PR), lateral entorhinal cortex (LEC), and medial entorhinal cortex (MEC). rf, rhinal fissure; PIR, piriform; POR, postrhinal area; VA, visual area. A full colour version of this figure is available at EMBO Journal Online.

