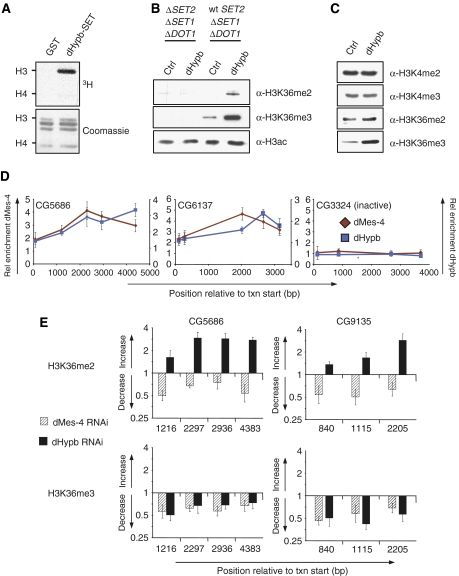
Figure 4.
dHypb methylates lysine 36 in vitro and colocalizes with dMes-4 at active genes. (A) dHypb shows histone-methyltransferase activity in vitro. Recombinant protein fragments containing pre- and post-SET domain (dHypb: aa 1351–1553, shown as gray bar in Figure 3A) were incubated with radioactive SAM and histones from calf thymus as substrates. Shown in the upper panel is the reaction product that was separated by SDS–PAGE and incorporated radioactivity measured by exposure to film. The lower panel displays Coomassie-stained SDS–PAGE gel and serves as loading control. Recombinant dHypb-SET shows HMTase activity to histone H3 in this assay. (B) dHypb methylates H3K36 in vitro. Western blot analysis displays H3K36 di- and trimethylation levels of HMTase assay with recombinant full-length dHypb using mutant yeast nuclear extracts deficient for H3K4me, K36me and K79me (ΔSET2, ΔSET1, ΔDOT1) or K4me and K79me (wt SET2, Δset1, Δdot1) as a substrate. A dHypb-dependent increase of di- and trimethylation is obtained only with chromatin substrate from wt SET2 strain, suggesting that dHypb requires premethylated lysine 36 substrate for its activity. (C) Western blot analysis of Drosophila Kc-overexpressing dHypb shows a specific increase in trimethylation. A similar experiment with full-length dMes-4 in Kc cells did not reveal robust changes in H3K36 methylation (data not shown). (D) ChIP analysis using antibodies generated against endogenous dMes-4 and dHypb along the body of two active genes (CG6137 and CG5686) and one inactive gene (CG3324). Shown is average and standard deviation from at least three independent repeats. X-axis reflects the base-pair position relative to the transcriptional start site. Y-axis reflects enrichment (bound/input normalized to an intergenic control). (E) dMes-4 and dHypb define distinct methylation states in Kc cells. Levels of H3K36 methylation states in RNAi and control cells were compared with ChIP followed by RT–PCR analysis. Shown is the ratio of H3K36me enrichments (fold change, Y-axis) of RNAi over control cells relative to the position from the transcription start site (X-axis) of two actively transcribed genes. RNAi against dHypb leads to a reduction of H3K36me3 in the coding region with a coinciding increase of H3K36me2 predominantly toward the 3′ end. Loss of dMes-4 leads to a reduction of both H3K36me2 and H3K36me3.

