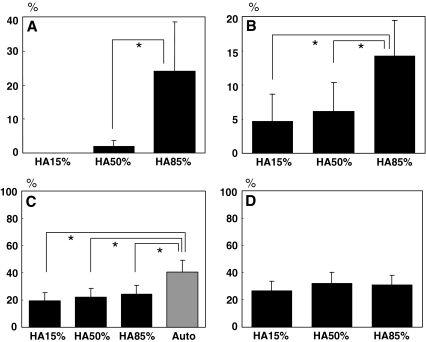
Fig. 5.
The results of quantitative histological analysis of the fusion mass. The bone ingrowth rate (BIR) (a) and the bone apposition rate (BAR) (b) are higher in the HA85% group compared to those in the HA15% and HA50% group. In contrast, there is no significant difference among the three HA groups in the bone volume rate outside the implanted granules (BV/TVout) (d), although it is significantly higher in the Auto group than any other groups in the bone volume rate (BV/TV) (c). (mean ± SD, * P < 0.05)

