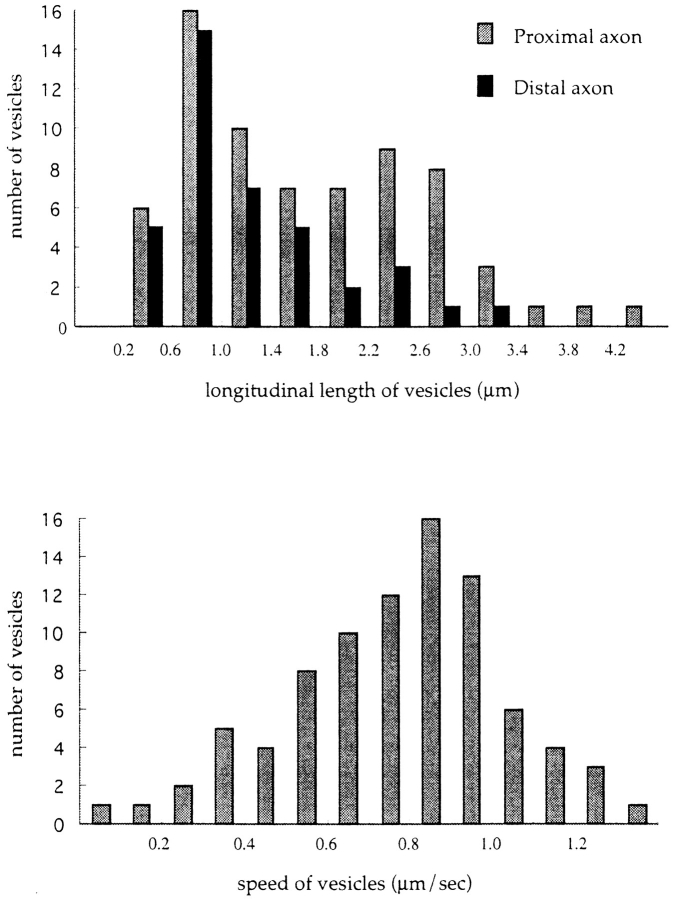
Figure 9.
Quantitative analysis of vesicle size and speed. (a) Histogram of longitudinal size of vesicles in proximal (n = 69) and distal (n = 39) areas of the same axon. (b) Distribution of speed of GAP-43–transporting vesicles. For this purpose, two adjacent frames from >20 different cells of observations were chosen (interval between the frames is 3.45 s). Then, the anterograde displacement of identified vesicles between the two frames was measured (n = 86). Note the single peak distribution ∼0.9 μm/s in the histogram. The speed was independent of vesicle size or shape (data not shown).

