
Figure 3.
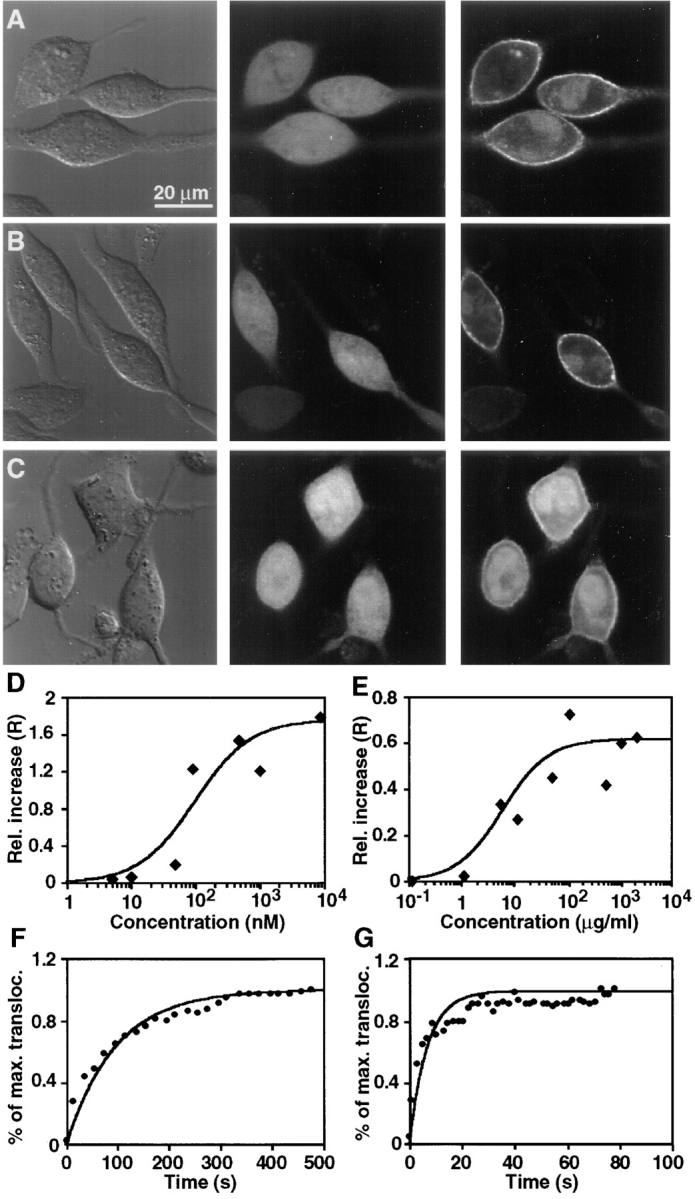
Translocation of Cys1–GFP in response to the addition of PMA or DiC8. Cells expressing Cys1–GFP were stimulated with either 1 μM PMA (A) or 100 μg/ml DiC8 (B). The left panels show DIC images of the cells before stimulation. The middle and right panels show fluorescent confocal fluorescence images recorded immediately before and 5 min after stimulation, respectively. Addition of PMA or DiC8 induced the translocation of most internal Cys1–GFP to the plasma membrane. The right images were corrected by an average photobleaching rate. (C) A less significant translocation was observed when cells expressing the proline mutant of Cys1 (mCys1–GFP) were stimulated with 1 μM PMA. D and E show the concentration dependence of the translocation of Cys1–GFP to the plasma membrane in response to the addition of different concentrations of PMA (D) and DiC8 (E). F and G show the time course of translocation of the Cys1– GFP probe upon addition of PMA (1 μM) or DiC8 (100 μg/ml). The translocation is shown as a relative increase in the plasma membrane fluorescence (R) as a function of time after PMA or DiC8 addition.