
Figure 1.
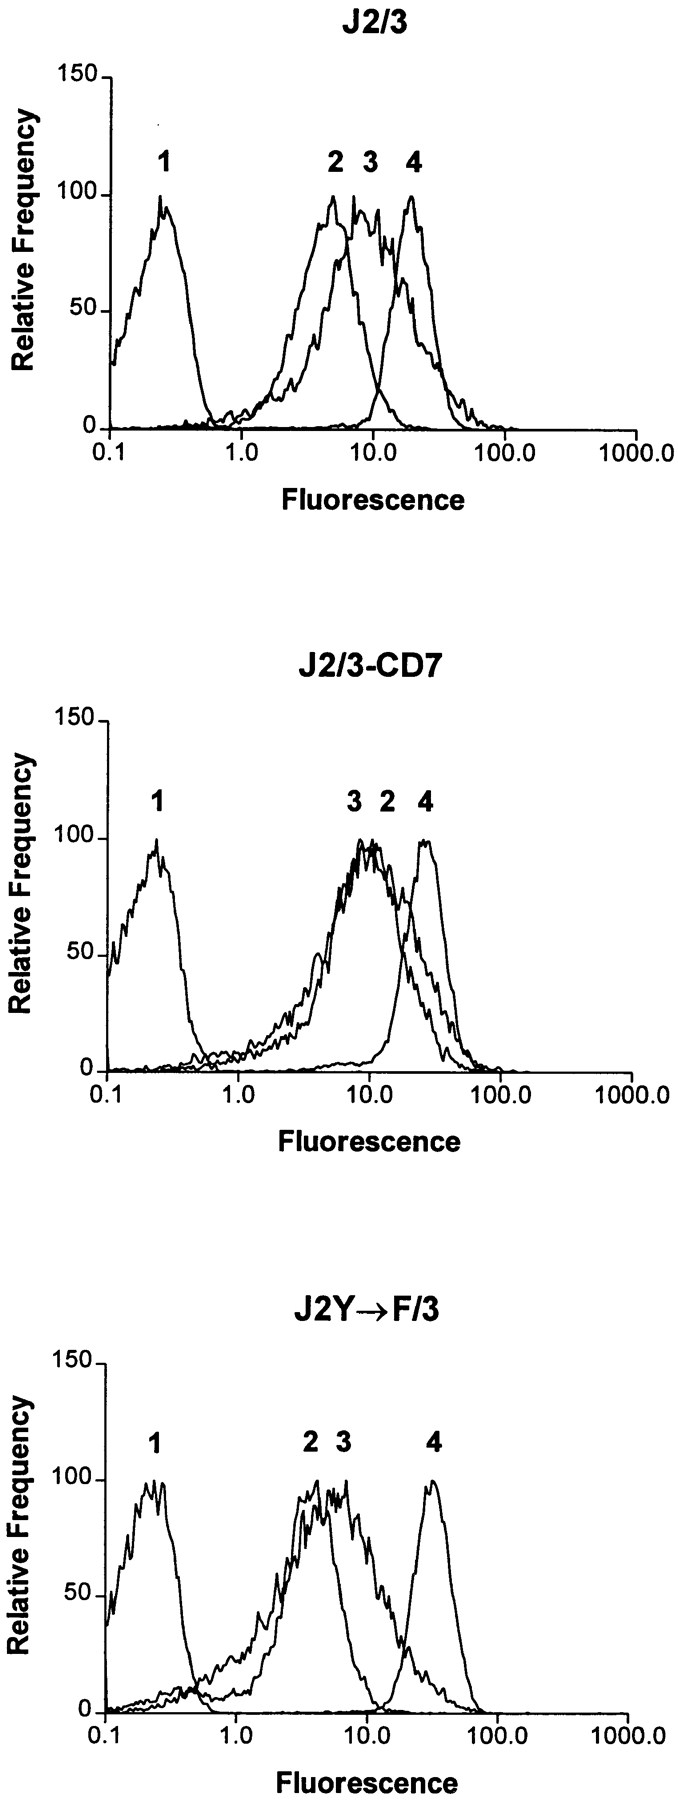
Fluorescent flow cytometric analysis of FcγR expression. Jurkat T cells (106) expressing various Fcγ receptors were resuspended in 50 μl PBS/5% FCS with 1 μg of the mAb IV.3 (2), specific for FcγRIIA, mAb 3G8 (3), specific for FcγRIIIB, or the mAb MEM-43 (4), specific for CD59. Cells were also stained with a negative control antibody (1). Cells were washed and then stained with F(ab′)2 fragments of FITC-conjugated goat anti–mouse antibodies and then analyzed by FACS®. Cells expressing wild-type FcγRIIA and FcγRIIIB (J2/3; top), wild-type FcγRIIA and the chimeric FcγRIIIB/CD7 (J2/3-CD7; middle), or wild-type FcγRIIIB and the mutant FcγRIIA where the tyrosines within the ITAM (Y282 and Y298) are changed to phenylalanine (J2Y→ F/3; bottom) are shown.