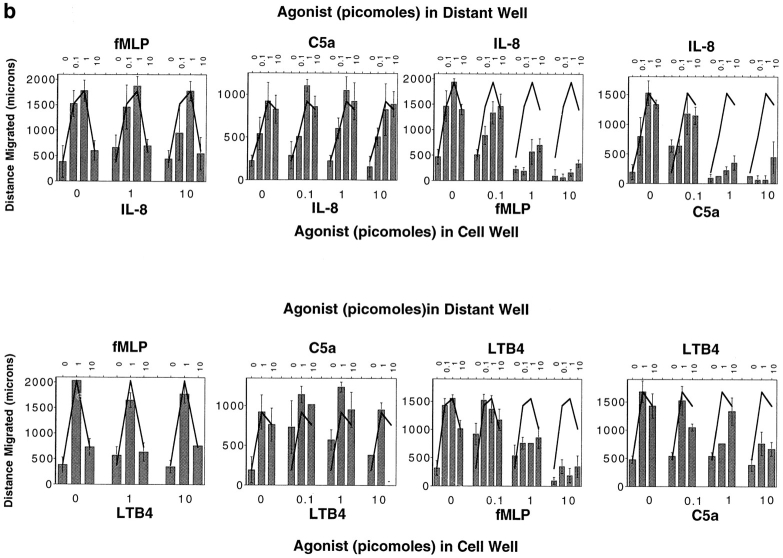
Figure 4.
The migratory behavior of cells originating at a source of fMLP or C5a. (a) Photographs of stained cells after 2-h migration to a source of fMLP, IL-8, or LTB4 (1 pmol). Cells originating in a well containing IL-8 or LTB4 (10 pmol) exhibit robust migration towards fMLP (top row); however, cells placed with fMLP (10 pmol) do not migrate towards IL-8 or LTB4. (b) Dose-response curves show the effect of varying concentrations of fMLP and C5a on migration to IL-8 and LTB4, and the effect of varying amounts of IL-8 and LTB4 on migration to fMLP and C5a. Each graph shows the data from a representative experiment of two to five performed with similar results; error bars indicate the standard deviation of the distance migrated for four replicates.


